

COMPTEL All-Sky Maps
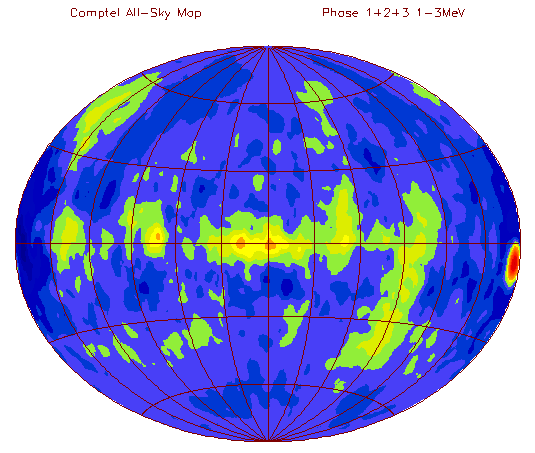
Click image for full size 1-3 MeV map

Click image for full size 3-10 MeV map
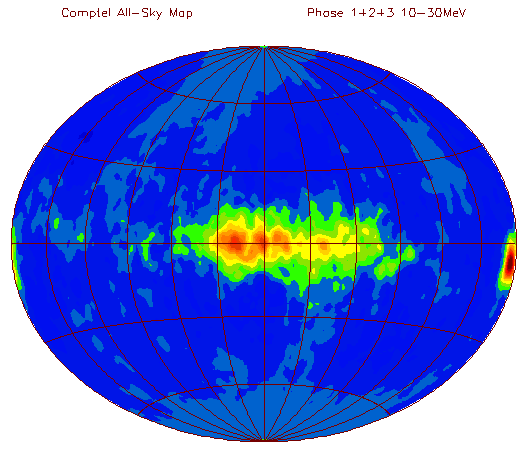
Click image for full size 10-30 MeV map
The COMPTEL all-sky maps were produced using the maximum-entropy method on data compiled from the CGRO mission phases one, two and three. Each image is an Aitoff projection with the galactic center at the origin. Gamma-ray emission is evident from the galactic plane and the peak intensity is produced by the crab nebula at the far right of the images.
If you have a question about CGRO, please contact us via the Feedback form.