

XMM-Newton RGS First Light - HR1099 2
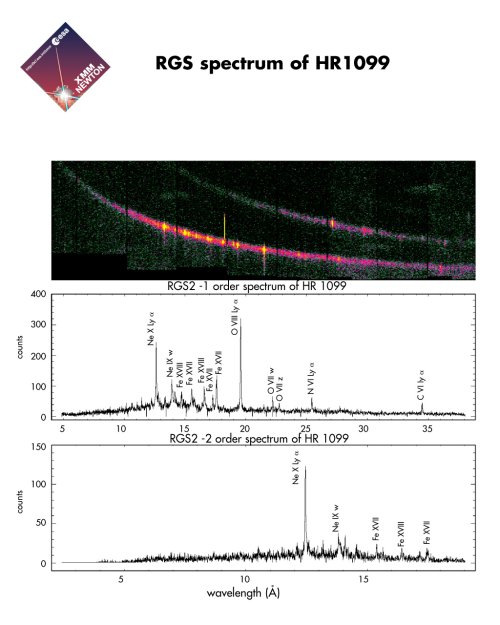
Image and text courtesy of ESA
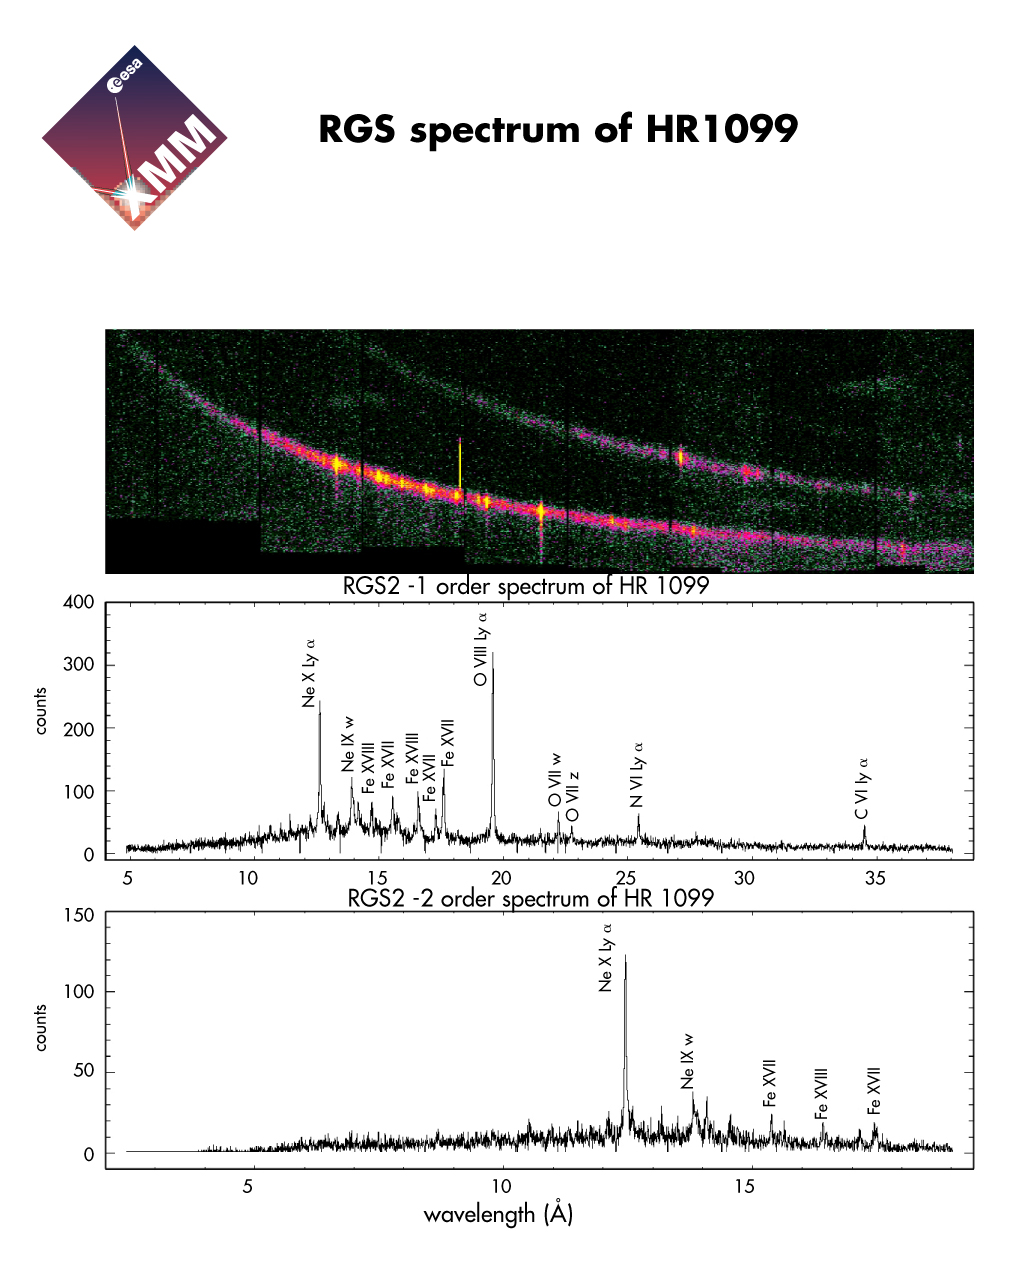
RGS spectrum of HR1099
The RGS spectrum of the star known as HR1099. This illustrates the wealth of detail offered by analysis of data obtained by the RGS instrument. The top panel shows the detected X-ray photons (X-ray light particles) plotted as a function of the position on the detector (strip of nine CCDs) along the horizontal axis and as a function of the energy of the photons, as determined by the CCDs along the vertical axis.Two bands can be seen, the bottom one which is the brightest is the so-called first spectral order, the top one is the second spectral order. The middle panel is a plot which shows the intensity or the number of detected photons along the vertical axis - versus their wavelength, a measure of their energy, along the horizontal axis.
Get the high resolution version.
If you have any questions concerning XMM-Newton send e-mail to xmmhelp@lists.nasa.gov
