
|
MLAMBDA/PI images, commonly known as banana
plots, are improved by overruling the default y-range by checking the
withyranges box and setting, e.g. yimagemin=0, yimagemax=2500.
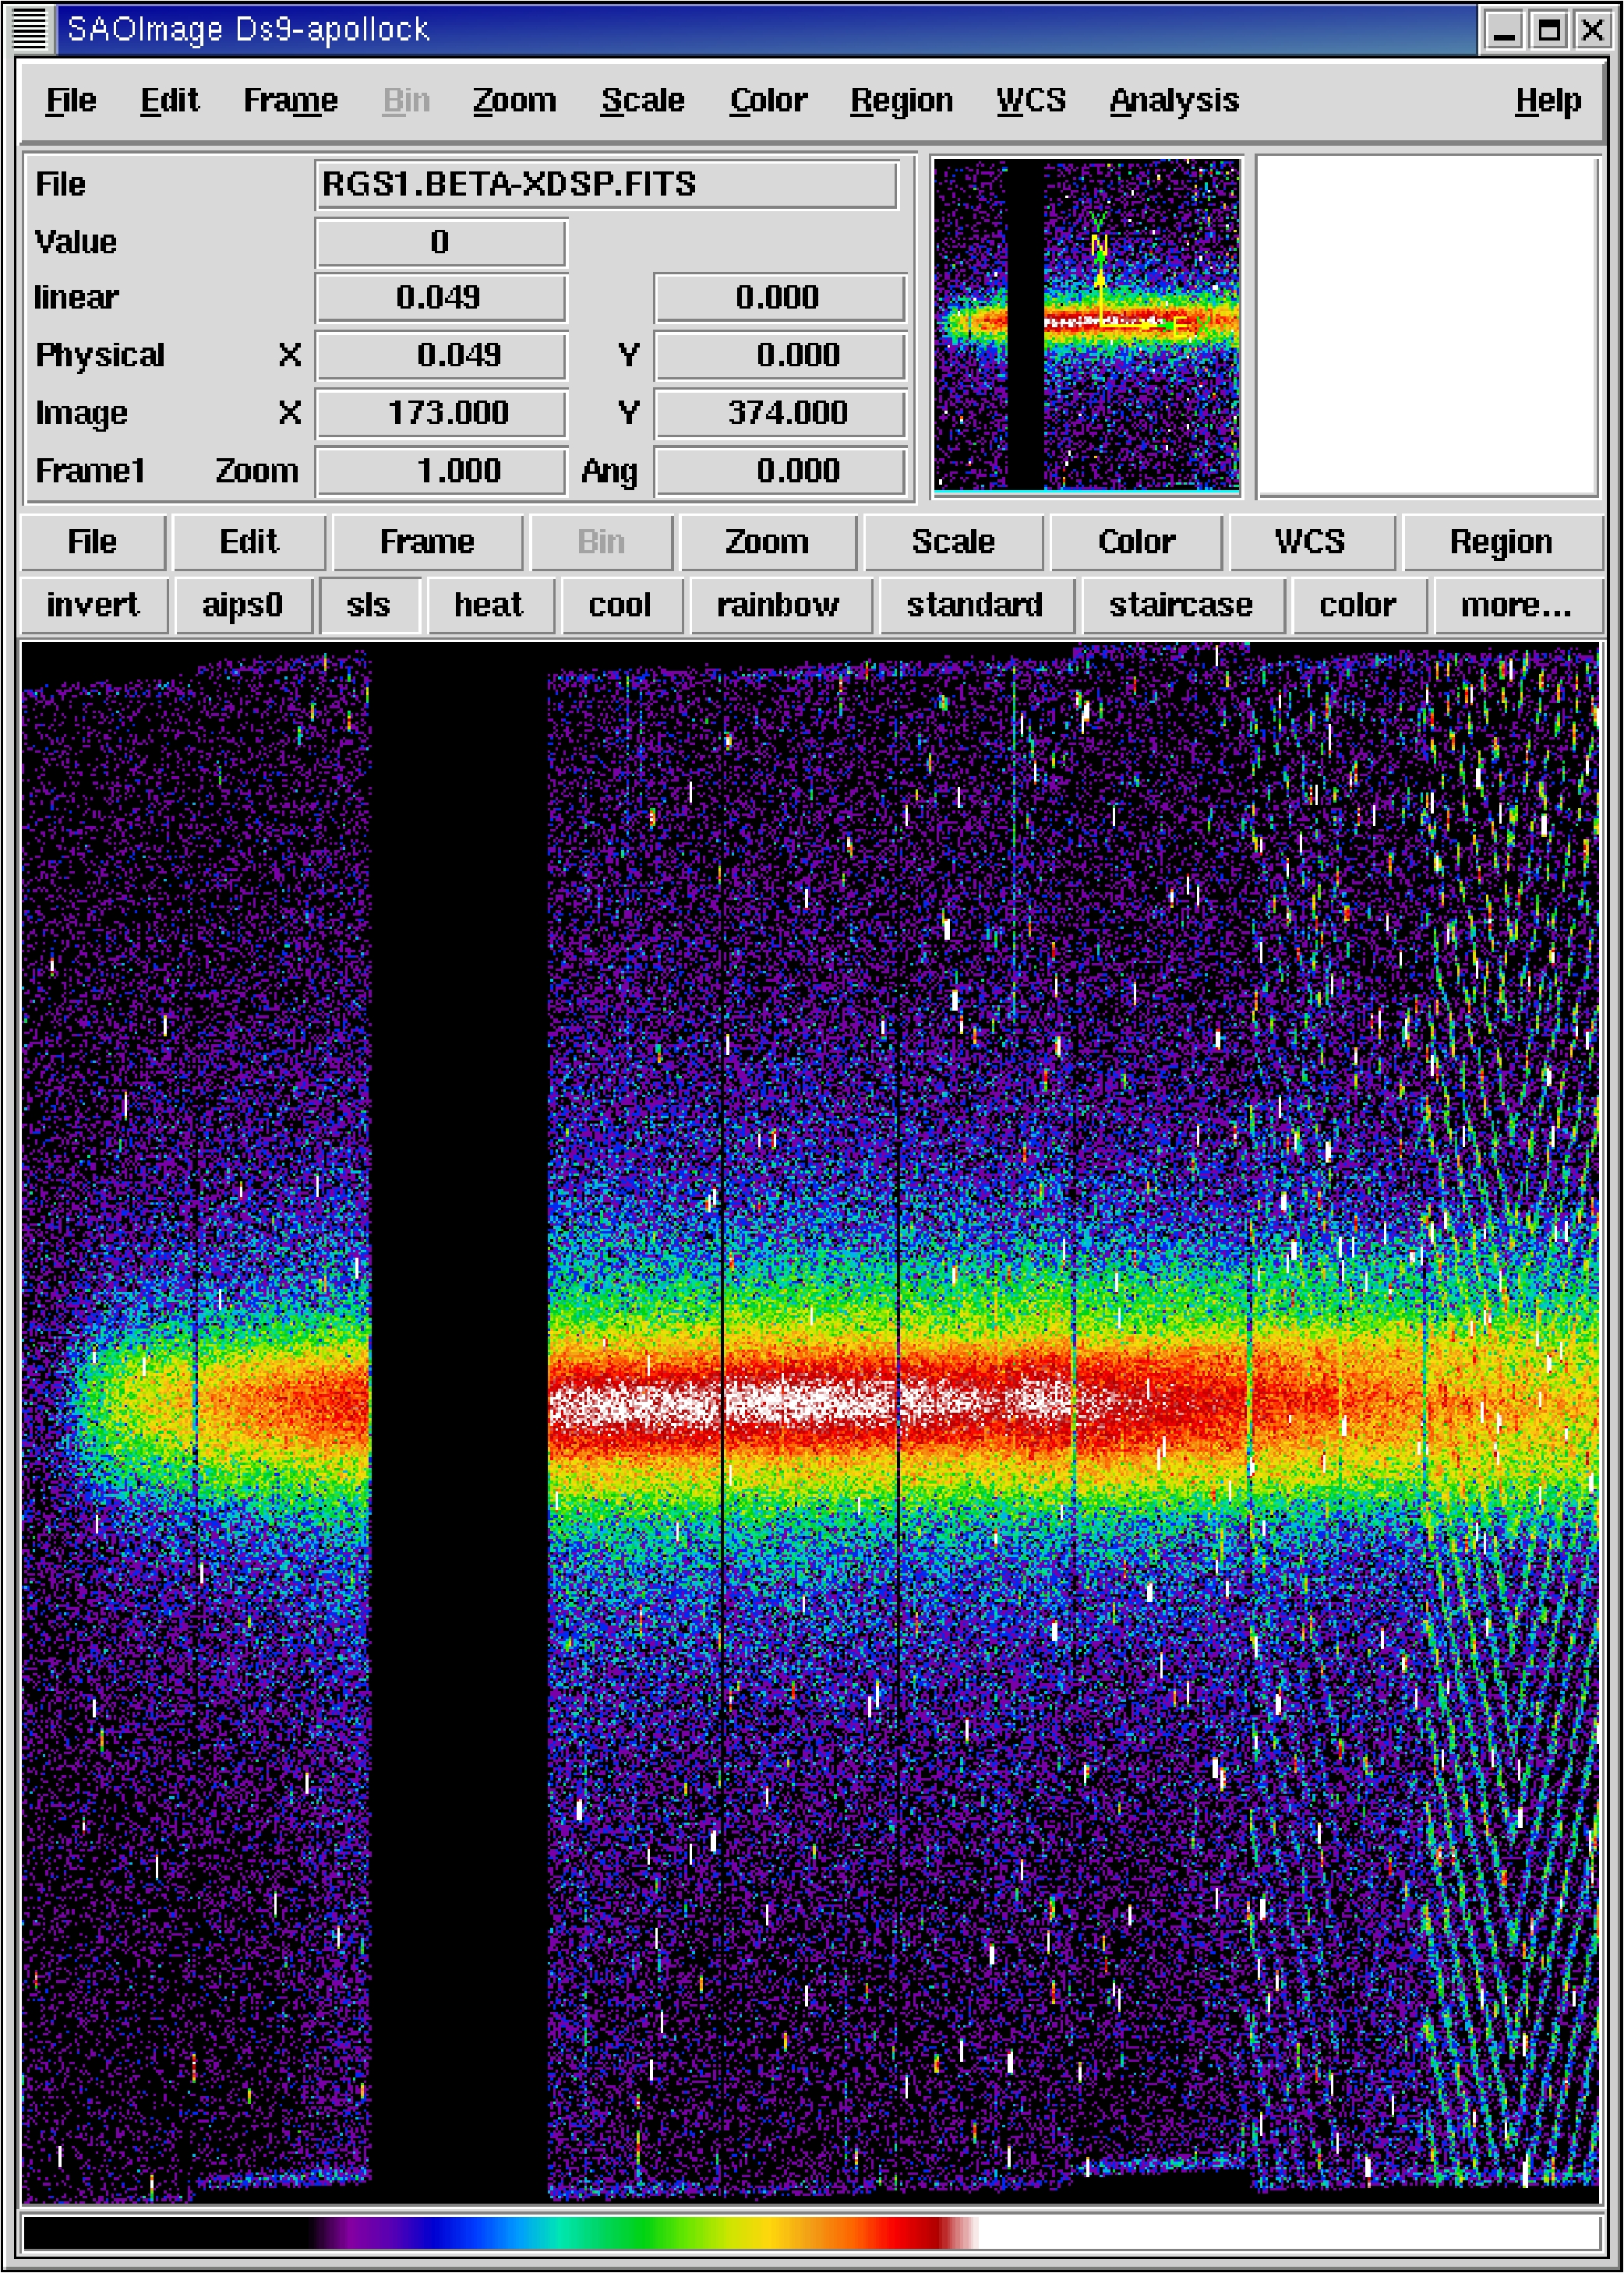
Fig. 36 shows plots of the merged RGS1 events. These
plots are orthogonal projections of the all-important
MLAMBDA,XDSP_CORR,PI 3-D RGS data space of the merged list of
all the events detected in the observation, thus showing all the
features of RGS data. The edges are clear of the 9 CCDs, numbered
1-9 from right to left. In both plots, wavelength and dispersion angle
increase from left to right.
|
The pointing coordinates were evidently chosen well enough to put this
bright source central in the aperture. The source was bright enough to
be seen up to 4th or even a weak 5th order in the characteristic
hyperbolic-shaped areas occupied by photons that have passed through the
gratings. There are plenty of hot pixels and columns and the so-called
fixed pattern noise shows as the herring-bone pattern in CCDs 1 and
2. Calibration sources of F K![]() at
at PI![]() eV span CCDs
2&3 and 7&8 ; and Al K
eV span CCDs
2&3 and 7&8 ; and Al K![]() at
at PI![]() eV span CCDs 3&4
and 8&9.
eV span CCDs 3&4
and 8&9.
The locations of the selection regions may be checked using the task rgsimplot
http://xmm-tools.cosmos.esa.int/external/sas/current/doc/rgsimplot
which plots them over MLAMBDA-XDSP and MLAMBDA-PI images
that are, in this case, most usefully generated from the screened events
files. Fig. 37 shows such an example.
 |


