November 9, 1999
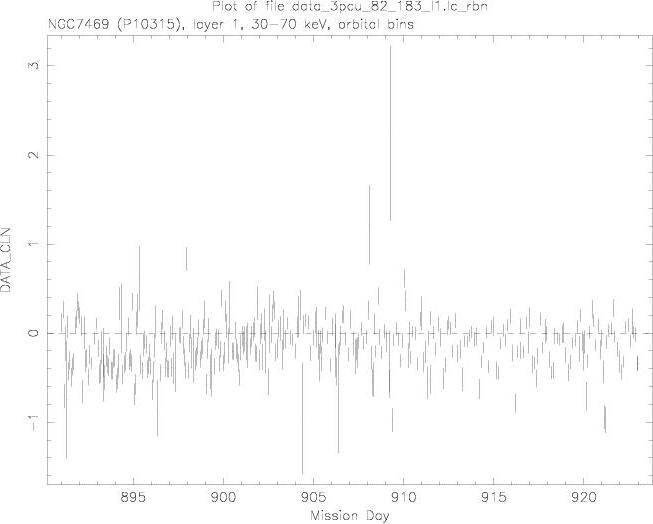
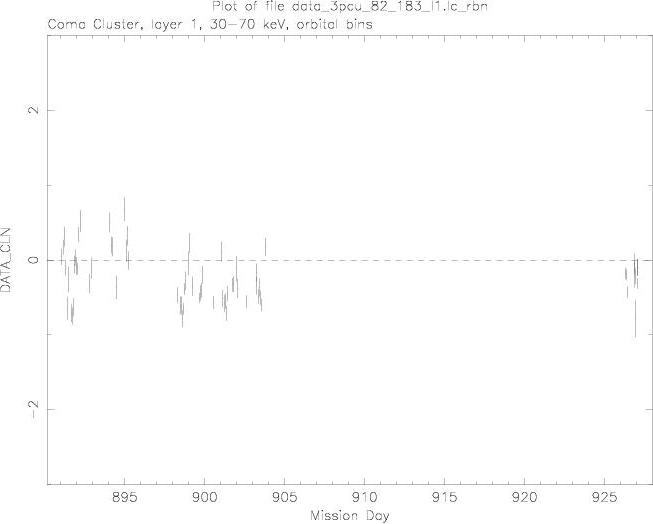
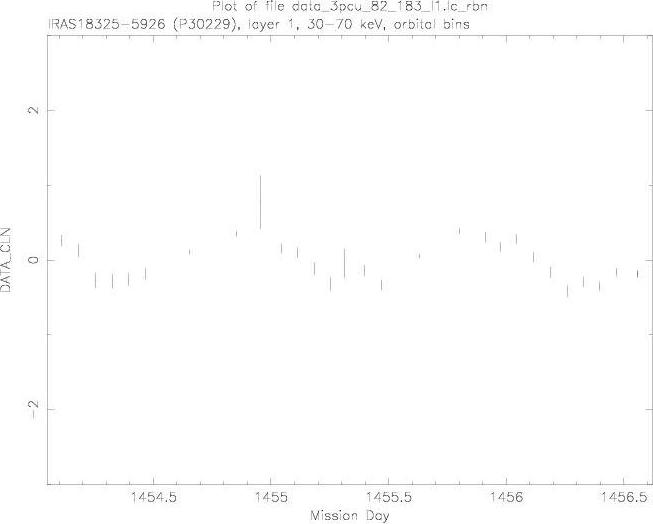
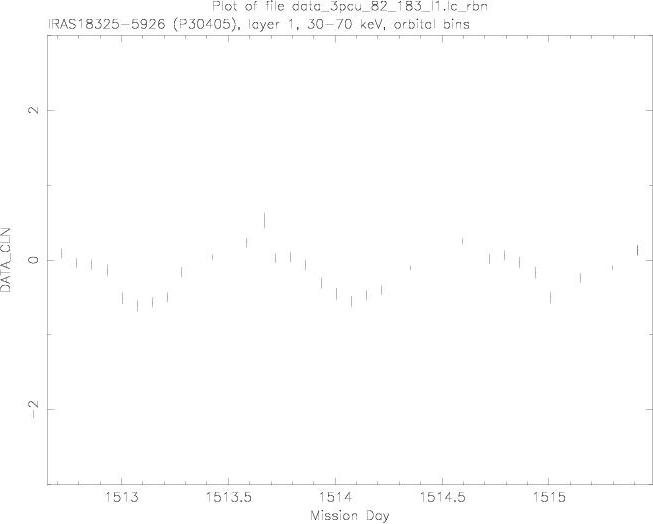
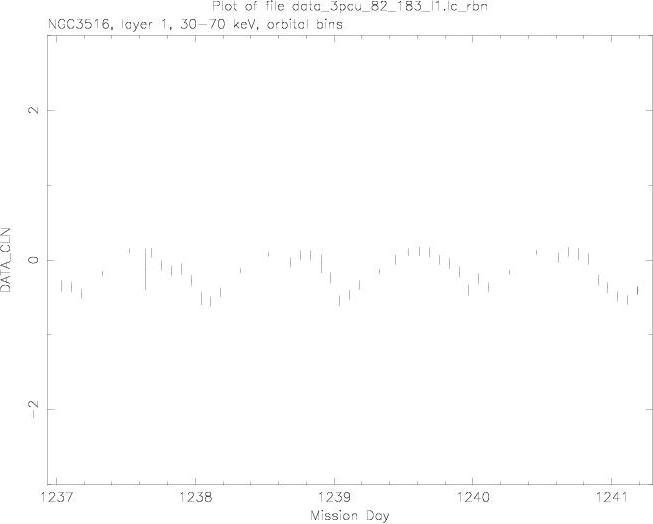
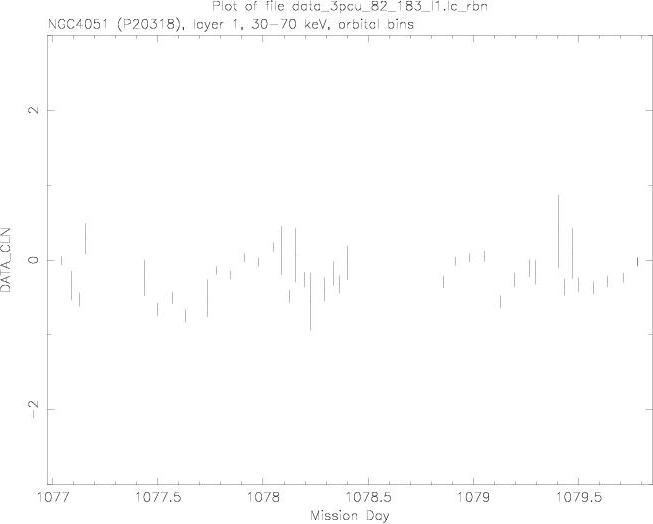
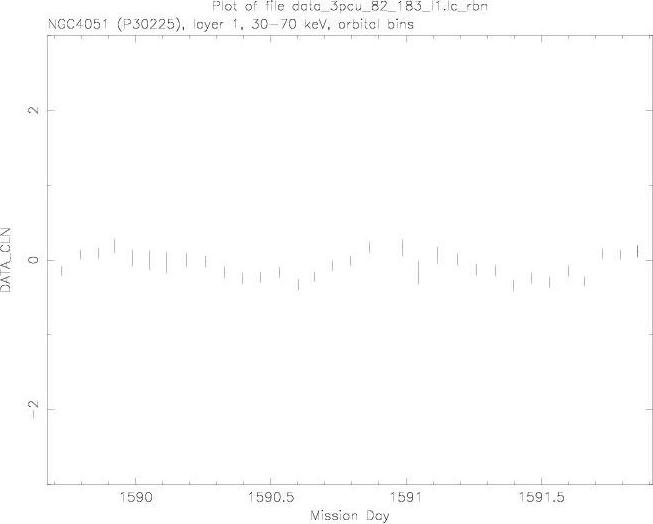
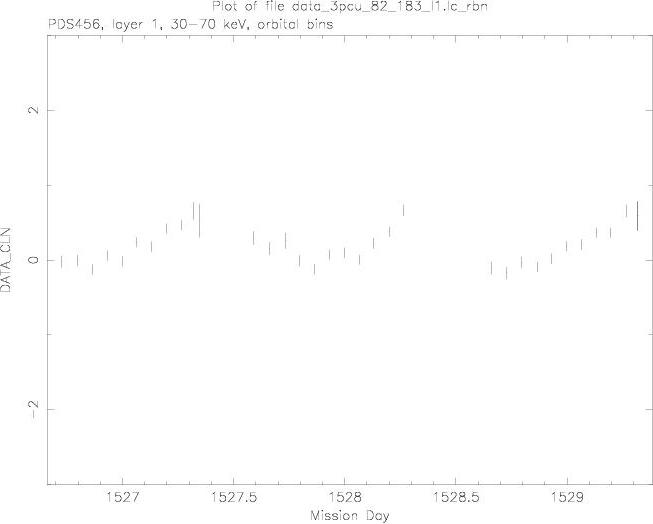
This note documents the existence of a daily variation in the
30-70 keV background subtracted count rate. This is similar to the
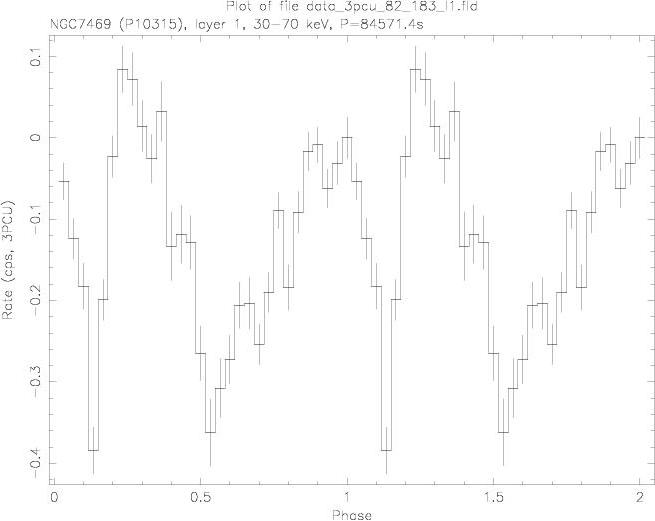
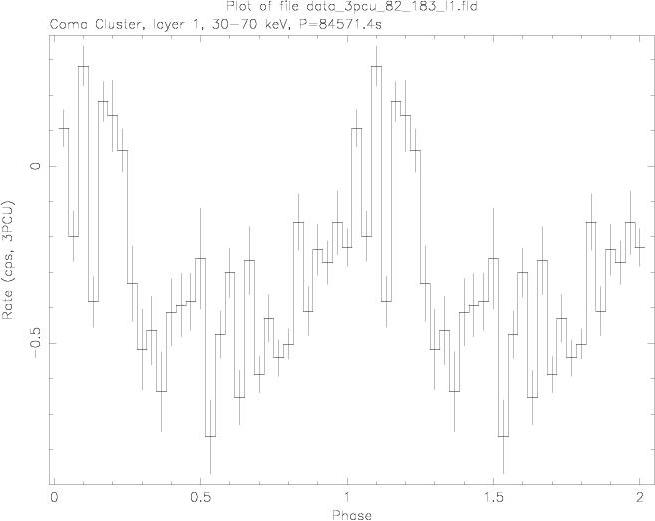
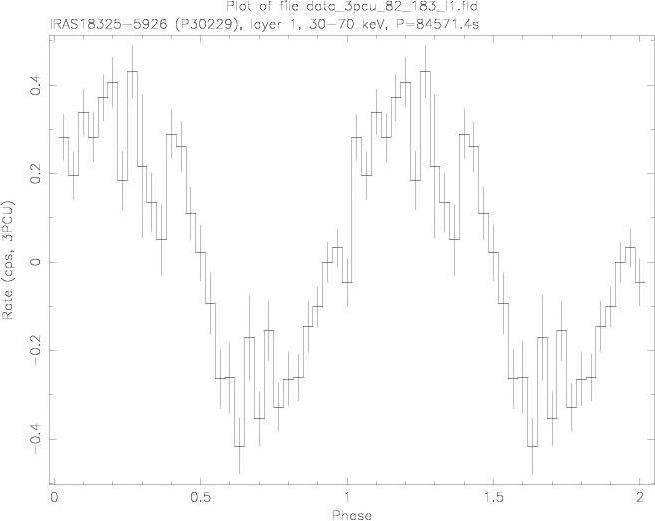
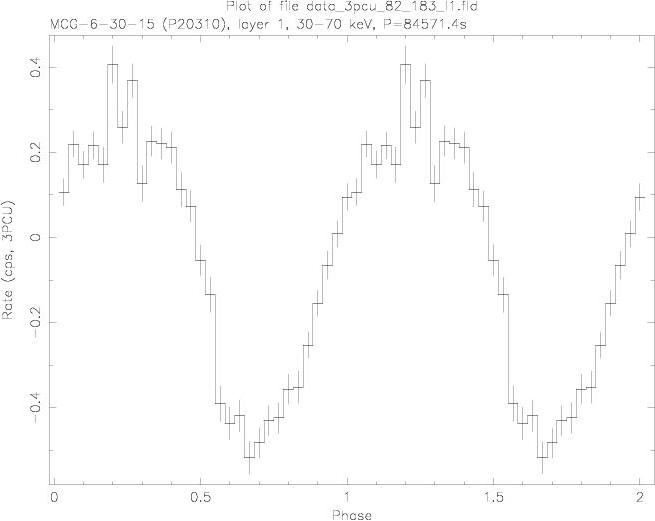
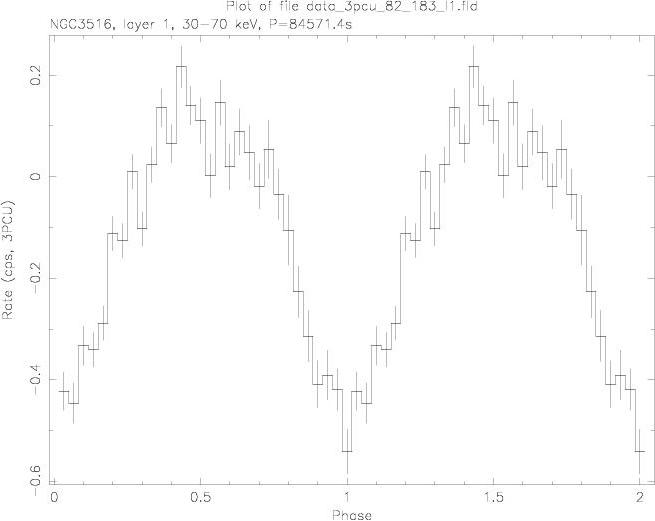
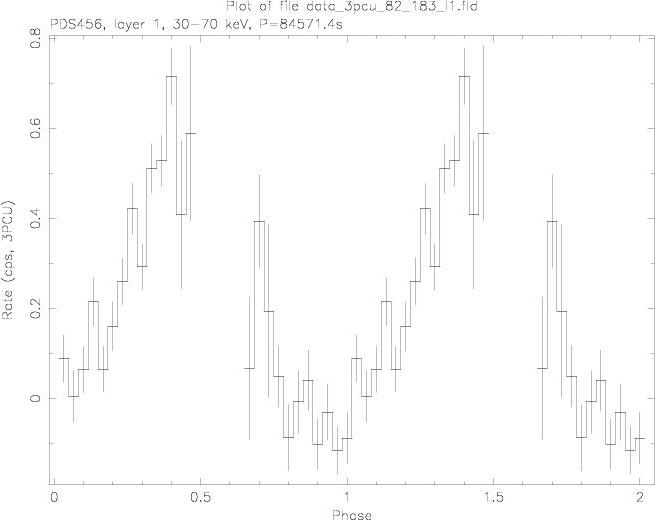
daily peak in the SAA dosage history. To determine the exact period, a
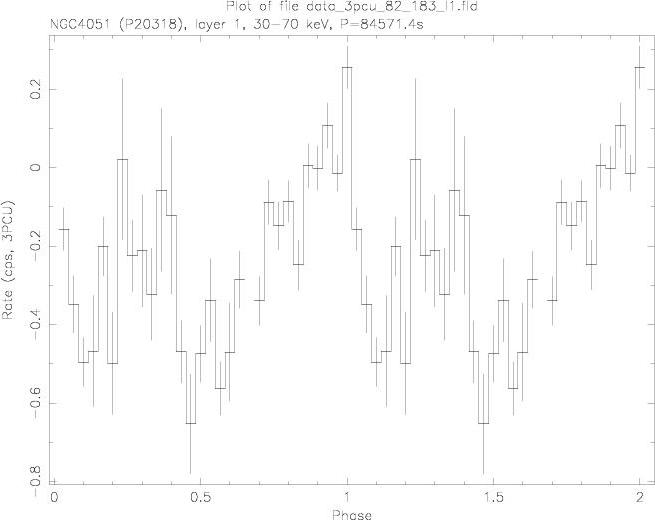
power spectrum was calculated using the Lomb algorithm (Press et
al.). The result was P=84571.4s, and the 30-70 keV light curves were
folded on this period, using a common epoch of MJD =
50096.5970138888879, which is the time of a daily peak in the SAA
dosage. The peak-to-peak amplitude of the variation ranges from ~0.3
to ~1.0 cts/s/3pcu. Contrary to earlier reports, there is no firm
evidence for a variation in the 0-10 keV light curves.
Background subtracted light curves were accumulated in the 30-70
keV band for several observations that have become public (table 1), using the standard selection criteria for
faint sources (table 2).
Table 2: Selection Criteria
| Criterion |
Description |
| (BKGD_THETAa < -70.0
or BKGD_THETA > 150.0) or TIME_SINCE_SAAb > 30.0
or TIME_SINCE_SAA < 0.0 |
Outside the South Atlantic Anomaly |
PCUn_ON  0.5 0.5 |
PCUn fully on |
| ELV > 10.0 |
Angle between the satellite pointing direction and the
Earth's horizon |
| OFFSET < 0.01 |
Angle between the satellite pointing direction and the
nominal field of view |
| VpX1L, VpX1R < 6.25 |
Veto rate between the propane layer and the left/right
halves of the Xenon layer |
| (VpX1L+VpX1R)/Q6c < 0.1 |
Normalized propane layer veto rate |
a Longitude of the ascending node of the satellite's
orbit
b Time since SAA passage
c Veto rate between six of the eight anode chains