


Next: About this document ...
Recent Progress on Improving the RXTE Proportional Counter
Array Instrumental Background
Dave Smith & Keith Jahoda (GSFC)
Rossi 2000 Meeting
22 March 2000
What's New? And What's Next?
- Background models are available for all gain epochs and source
brightnesses
- Characteristics of the PCA residual background and the next
generation models
Systematic Error in 3pcu (1 mCrab ~7 cts/s/3pcu; 2-10 keV)
| Energy band |
cts/s |
cts/s/chan |
% bkgd rate |
| 2-10 keV |
0.15 |
7.5E-3 |
1.5% |
| 10-20 keV |
0.03 |
1.3E-3 |
0.5% |
| 20-50 keV |
0.10 |
2.2E-3 |
0.6% |
The residual background can be described as follows
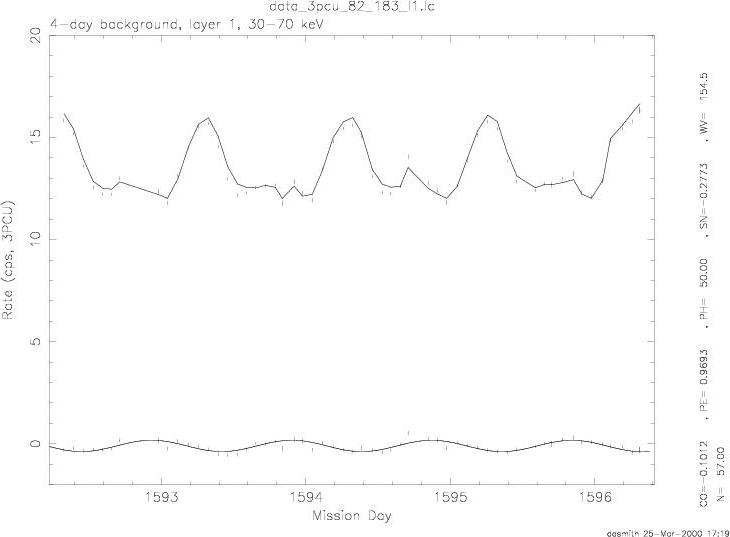
- Daily variation in the 30-70 keV band
The observed rate
(sky plus internal background), model predicted rate, and the
observed-model rate are shown for the 4-day background observation (Figure 1). The observed-model rate (lower points)
was fitted by a sine wave to emphasize the daily period.
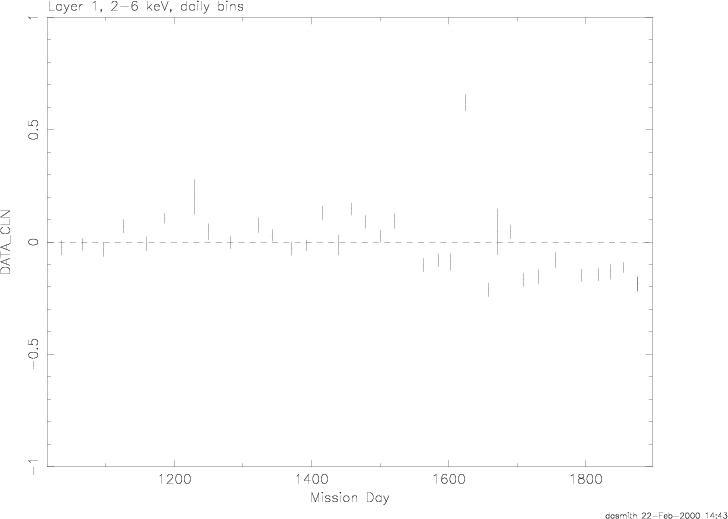
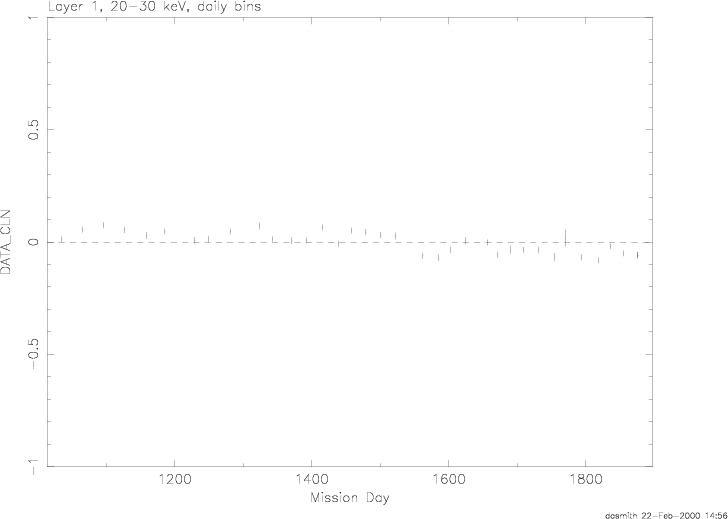
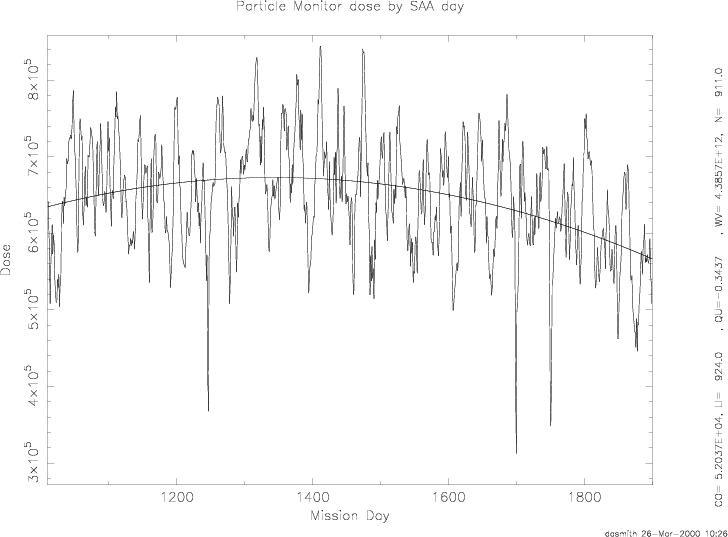
- Long term trend in the background subtracted light curves
The observed-model rate for the 2-6 (Figure
2) and 20-30 keV (Figure 3) bands are
shown. The SAA dosage, as measured by the particle monitor on board
HEXTE, is shown for the same period (Figure
4). The long term trend in the the SAA dosage is present in the
background subtracted light curves.
Next generation models
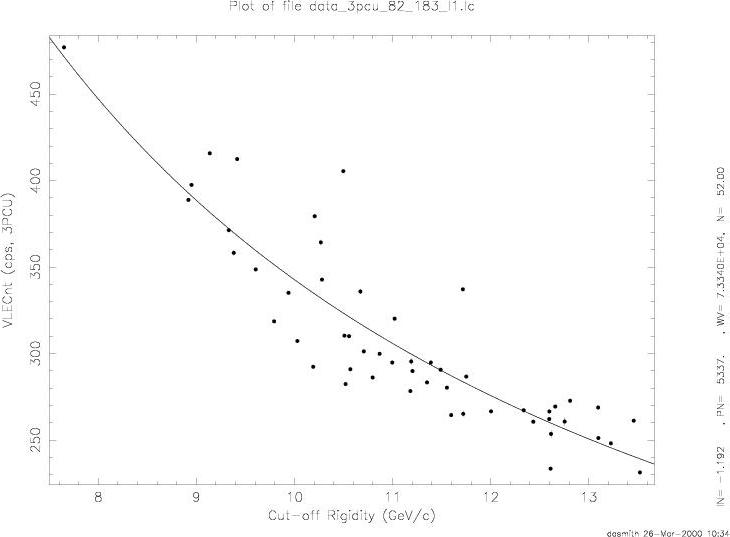
- Model component based on either VLE rate or Cut-off Rigidity (COR)
The dependence of the VLE rate on the COR is shown for the
non-SAA orbits (Figure 5). Following Hayashida
et al. (1989), the data were fitted by a power-law model: VLE = K x
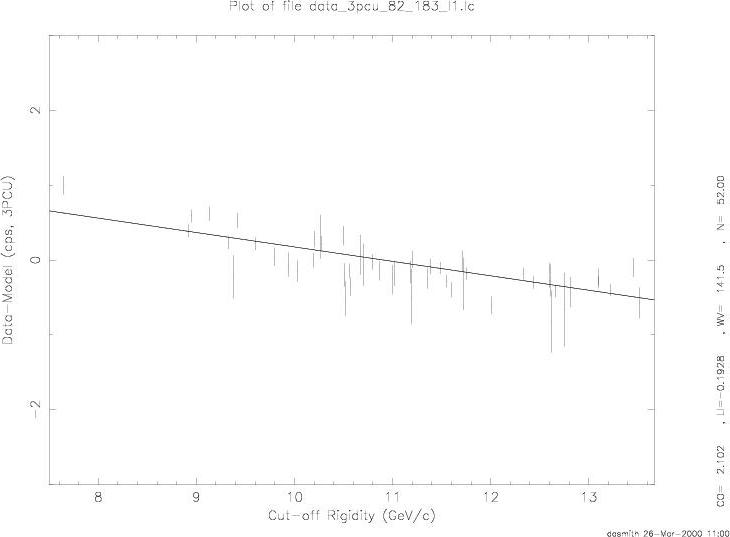
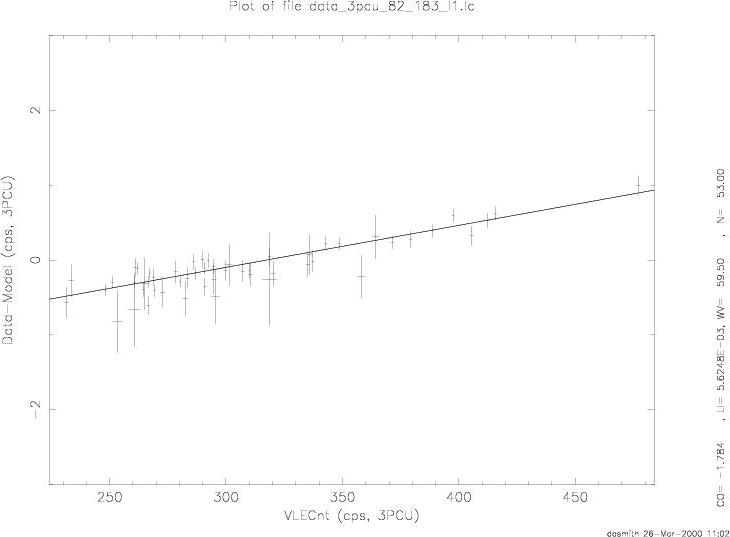
COR-1.1. The dependence of the 30-70 keV background
subtracted count rate on the COR (Figure 6) and
VLE rate (Figure 7) are shown for the non-SAA
orbits. There is a clear correlation between the VLE rate and
observed-model rate. A similar result is evident in data accumulated
from the SAA orbits.
- Subtract the long term trend from the data
Next: About this document ...
Dave Smith
2000-03-25