The Xamin Web Interface
This document describes how to use the Xamin web interface. The tutorial
illustrates Xamin in a series of videos.
The following sections comprise a
comprehensive reference manual which discusses each element of the web
interface.
Additional information on Xamin is available in other documents.
Additional how-to videos of the web interface are available from the
Xamin Introductory Page.
If you want to use Xamin capabilities outside of the
web/browser environment take a look at the Xamin
CLI Guide. If you are interested in the overall architecture
of
Xamin, the Xamin System Guide can
help.
An Xamin Video Tutorial
This section uses a sequence of videos to illustrate increasingly complex
uses of Xamin. These videos are not exhaustive guides to a topic, but show
how a user might interact with the system in practice. If you view these
you should have a good feel for most of the key capabilities of the Xamin interfaces.
The first thing you might want to know when starting a project, is what data the
HEASARC has on one of the objects you typically study. Our
index query video shows how
you can find which HEASARC tables have data on 3c273, and how you can
then query any of these.
The archetypical HEASARC archive session is to get
some data to analyze. To get data from a mission you first
need to specify the table you are interested in. Depending upon
whether you already know, there are several different ways to specify
a which table you want to query. Then you find the rows that match
the observations you are interested in and get the associated data.
The
table selection and
query to data download
videos illustrate how you can be downloading data in just a few seconds.
Cross-correlations are easy in Xamin and the
correlation video
illustrates how you can correlate ROSAT and ASCA observations, including
setting your own correlation radius and specifying non-positional constraints
on the query.
Xamin allows some fairly sophisticated analysis in queries. We plot the
average flux of ROSAT FSC sources as a function of galactic latitude in our
parameters and plotting video.
In this query none of the original rows in the table are used, only parameters
the user defined.
In addition to using HEASARC tables, you can upload your own information
into Xamin and correlate with HEASARC tables to find matching data. You
can even anti-correlate and find the objects in your list that haven't yet been
observed. Our
user upload video
shows how you can easily do this even with an Xamin user account.
If you set up a user account you can save results, build up complex
queries from session to session and let Xamin tell you when things change.
Our account setup
video
shows how quickly you can get an account. Saving query results and
the configuration you used to run a query is shown here.
The monitoring video
shows how you can be notified whenever we get more data on a target or when any
query result changes.
Many missions have a rich hierarchy of data products. Our
product control video
shows how you can filter for only the products you want. The
script video
shows how you can create a shell script to download data products offline from
your web session.
Reference Manual
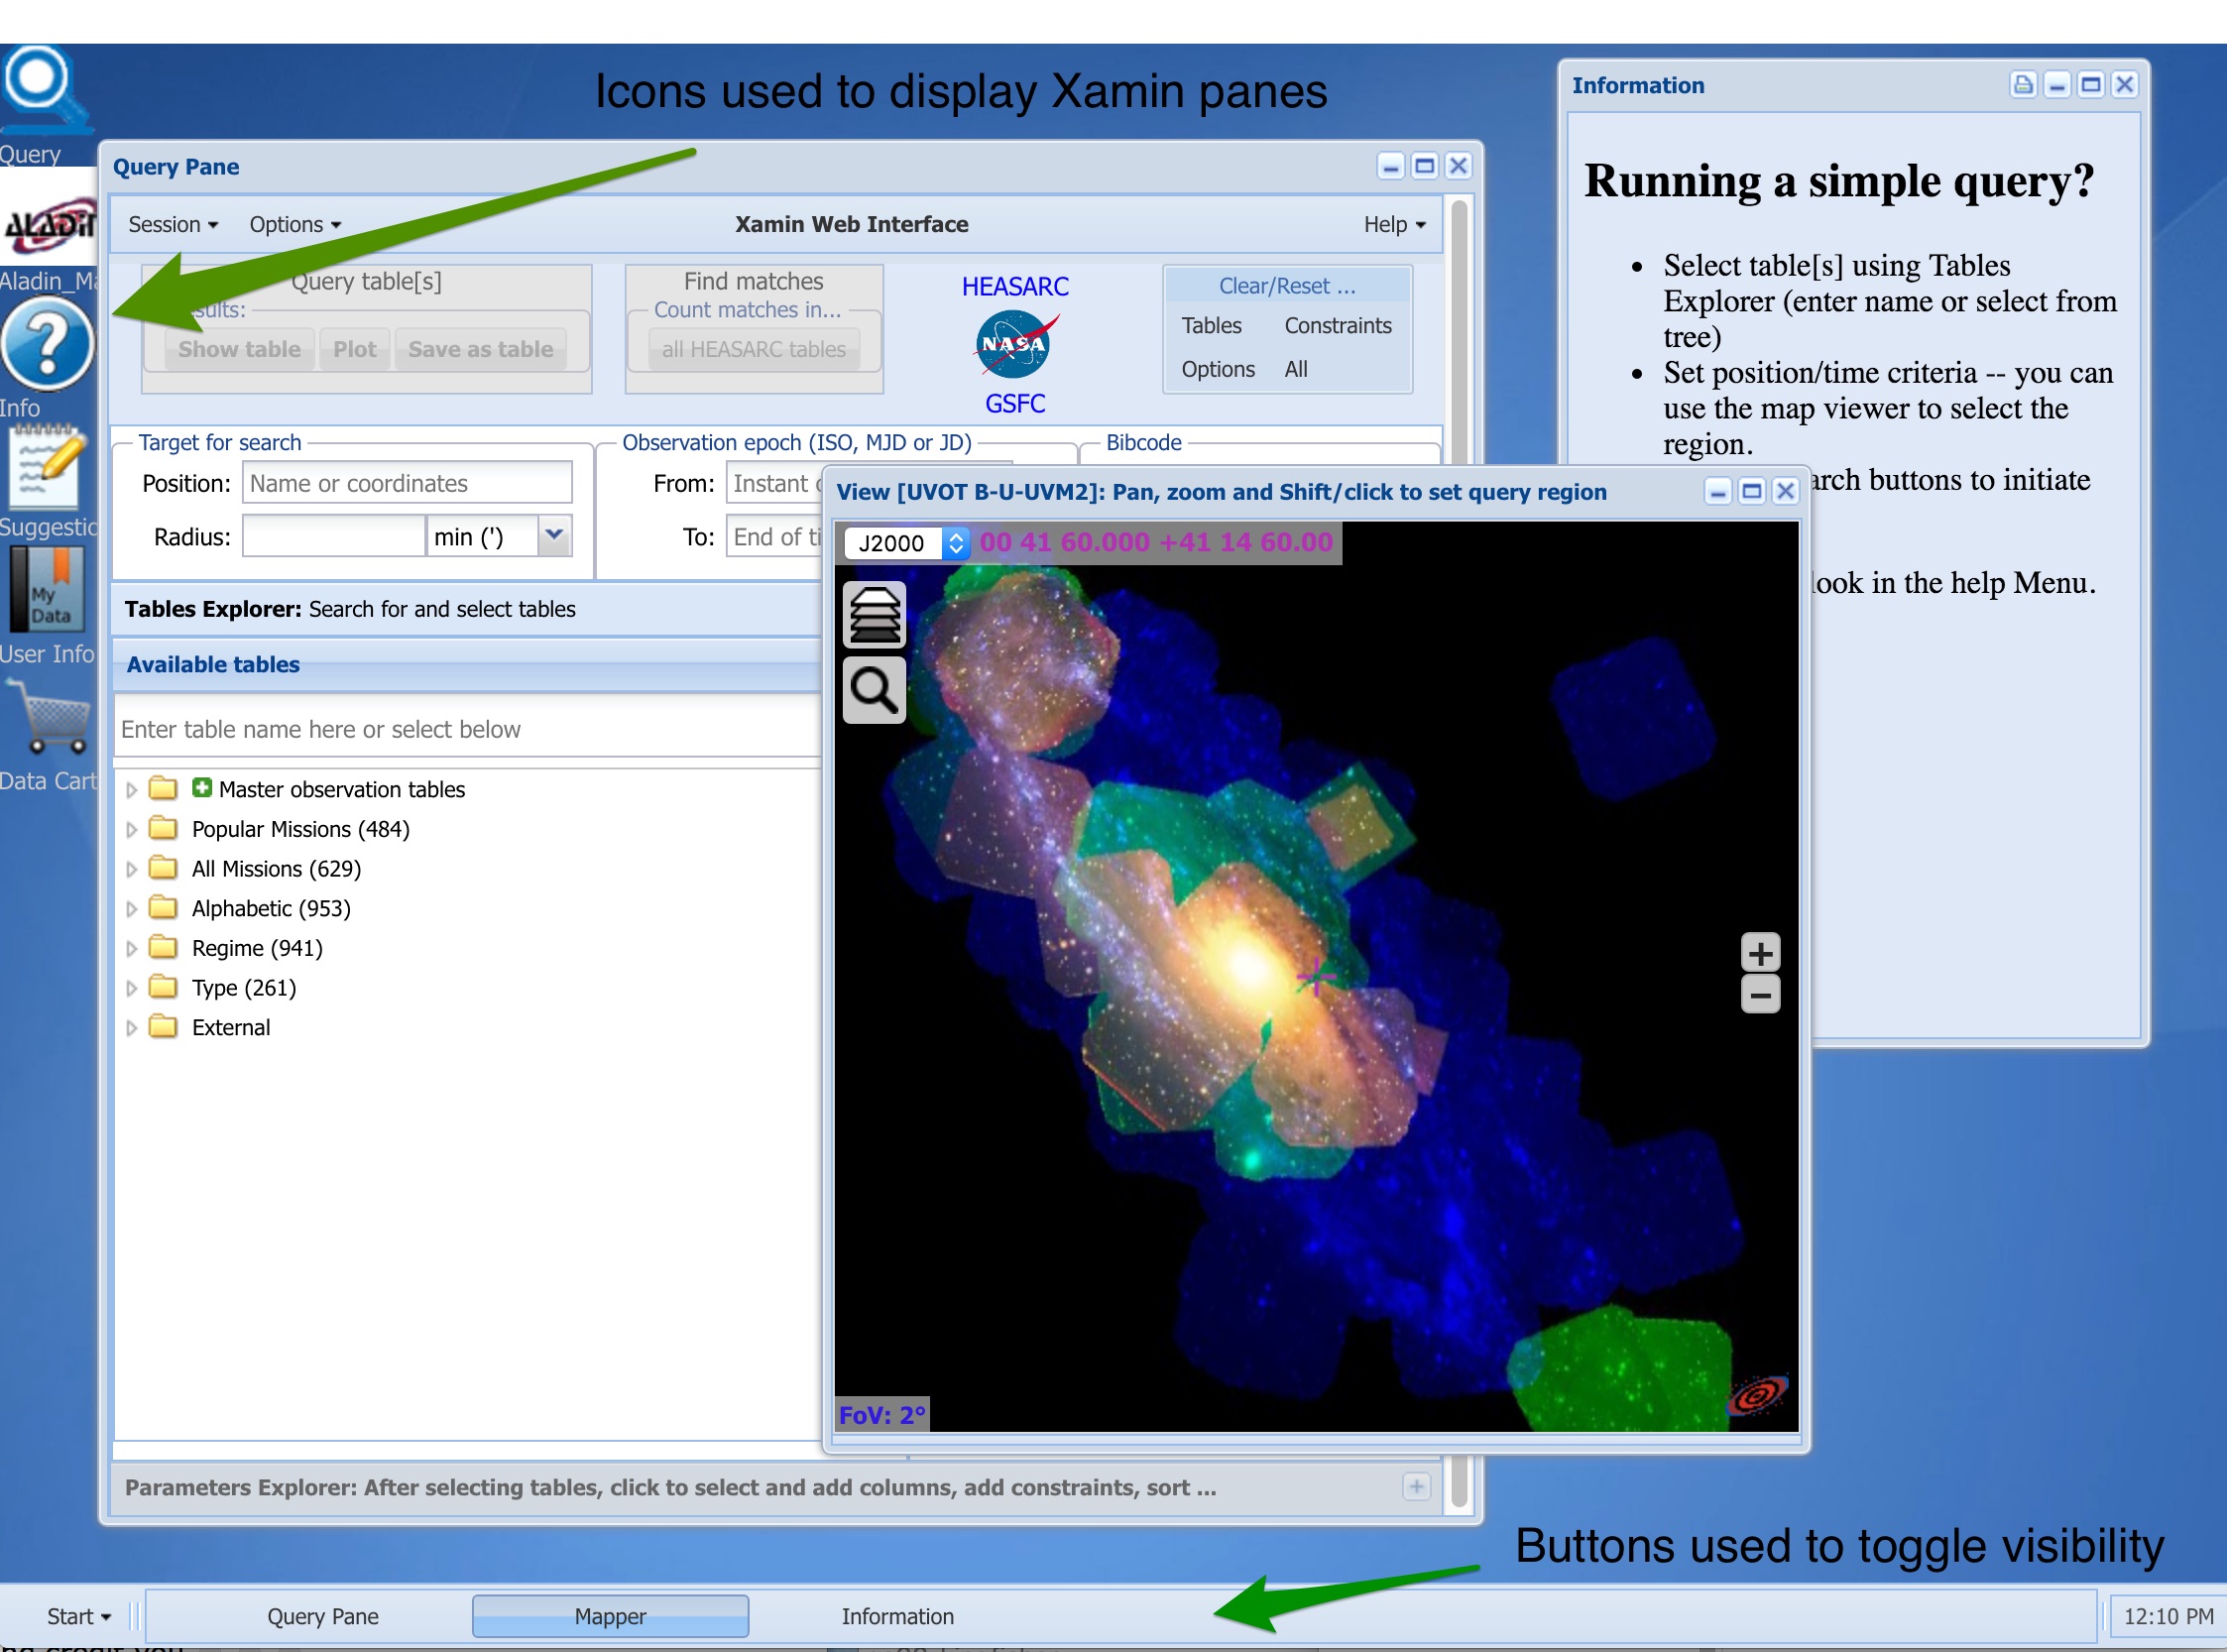
Click for larger view
The Xamin interface provides a powerful Web based GUI to query the
HEASARC and other databases. Xamin uses a number of sub-windows that
are rendered within a single browser window. To minimize confusion,
these sub-windows are called panes in this document. The term window
is reserved to mean a browser window. Depending upon the browser and
user settings a browser window may be a full window or a tab panel
in tabbed-browser window.
Many panes are persistent. They can be dismissed and recovered
with the same state. Results panes, e.g., tables and plots are not
saved and the database must be re-queried to regenerate them if
you delete them. You can minimize or hide them if you want to get
them out of the way. Table 2.1 summarizes the Xamin panes.
Various prompts, errors
and acknowledgements also use small popups. Their meaning should
be clear in context. Many of these are modal -- you won't be
able to access other content until you respond to the popup.
Panes can be moved and resized freely and may partially or
entirely obscure windows below them. The visibility of
most non-modal panes can be controlled by buttons at
the bottom of the Xamin window. If the pane is nominally visible
but partially or totally obscured by other panes, then clicking
on the button moves it on top of all other panes. If it is already
on top, the pane is hidden. If the pane is hidden, clicking makes
it visible as the top pane.
| Pane |
Initiated by... |
Purpose |
| Query |
Xamin startup |
Main window of the interface. Compose and initiate
queries. |
| Aladin Mapper |
Xamin startup |
Provides interactivity between results and images of sky (positional queries only). |
| Info |
Xamin startup |
Startup hints, table documentation. |
| Table |
Running a query |
Show table results. May show data products. If the
user has requested a discovery query, the initial
results may be list of tables with data matching
the user request. |
| Matching tables |
Keyword search in Tables Explorer |
Show tables matching keyword search. |
| SkyView Preview |
Running a positional query |
Show SkyViewpreview images |
| Plot control |
Requesting a plot result from the query pane |
Specify plotting parameters for the given query |
| Plot |
Requesting a plot from the plot control pane |
Show plot results. |
| Products cart |
Selecting products from a query result |
Filter and download products. |
| User account |
Login or Session menu/User tables-info |
Manage user account and tables. |
| Feedback |
Panes control |
Provide feedback and bug reports |
| Product selection |
Table pane/Edit products |
Select which products to retrieve for a table |
Each of these panes will be described in turn.
The Query Pane
The query pane is the primary element with which the user will
interact during their Xamin session. Here is where the user selects
tables, defines constraints and initiates queries. Initially the pane has a title bar or
"Query Pane", but if you login, the name you are using will be indicated.
The remainder of the query pane, under the title bar, is divided into sections stacked
vertically which are described in turn below.
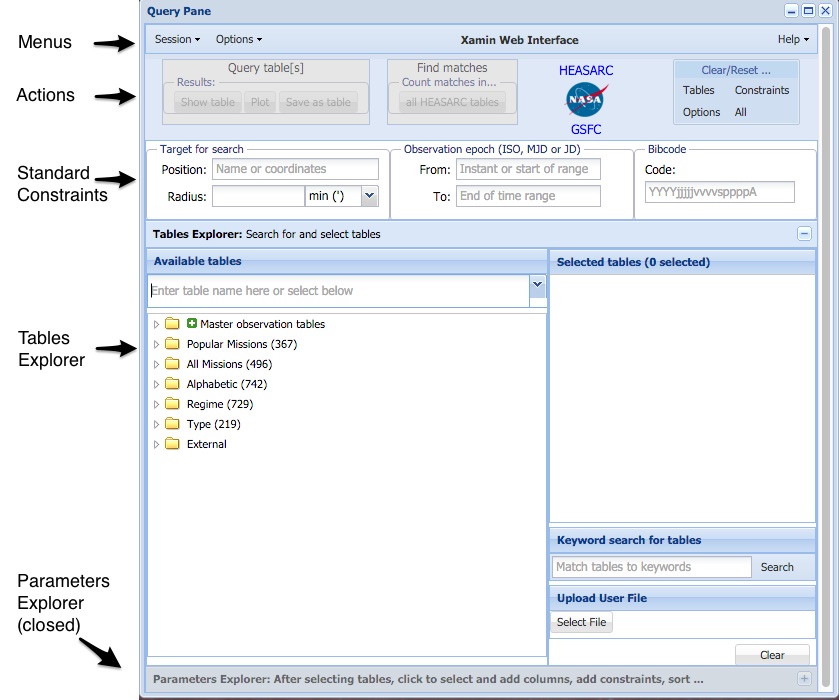
The Menu bar
The menu bar is used to manage user
sessions and set options for user queries. The menu bar also
provides a help menu with links to on-line documentation (including
this document).
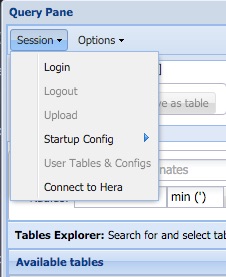
The Session Menu
The session menu is used to control the overall characteristics of
your connection with the Xamin server. Most of the options in the
session menu are unavailable until a user logs into Xamin.
- Login. This will initiate a login process where a user may log
into an existing account or create a new one. The login service
is independent of
Xamin and may be used for other services.
- Logout. Log out of the current account. Disabled if not
logged in.
- Upload. This will bring up the file upload menu which allows
you to upload source files and tables in a variety of format.
Disabled if not logged in.
- Startup config. Xamin allows a user to try to save
the current query configuration into a cookie. If set
this cookie will be applied whenever you start up Xamin.
E.g., if you usually do queries in Galactic coordinates,
then set that option in the Options menu, and select
the Session/Startup config/Set selection. Next time
you start an Xamin session in the same browser, Galactic
coordinates will be selected automatically.
Unfortunately the space available in cookies is limited,
so typically only menu options can usually be saved this way. To
save complete query configurations, including
tables and constraints users will normally have
to use the Save configuration options associated
with a user account.
If in the middle of an Xamin session you wish to
reset the query state to your saved configuration,
you can used the Startup config/Reset option.
If you wish to clear the cookie used to store
the configuration, jut click Startup config/Clear.
- Restore session. Restore the configuration of your Xamin
session from a previous state that you have saved.
- User tables & Configs. Show the account summary page
which allows you to manage your saved tables, to set up
periodic tests to see if results have changed, and
to save and restore complete query configurations
of any complexity.
The Options Menu
This menu affects the way each query is interpreted and the results
generated.
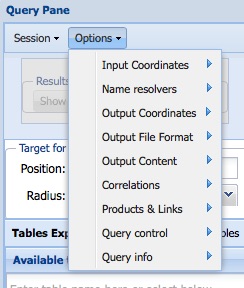
Input coordinates.
Select one of the radio buttons to set the coordinate system that
will be used for coordinate strings input in a positional query or
in a source list. This does not affect the results if target names
are entered. The supported coordinate systems are
- J2000: Julian equatorial coordinates in epoch 2000. For essentially
all HEASARC tables these are indistinguishable from ICRS coordinates.
- Galactic: Galactic coordaintes.
- E2000: Ecliptic cordinates in epoch 2000.
- B1950: Besselian coordinates in epoch 1950.
Name resolvers.
Check the name resolvers that you would like to be used in
converting names to coordinates. Normally all name resolvers
are used, but you can uncheck one or more. The supported resolvers are
- SIMBAD: The CDS's SIMBAD name resolver.
- NED: The NASA Extragalactic database name resolver.
- GRB: An internal HEASARC name resolver that understands
the locations of many GRBs.
Output coordinates.
Specify the coordinate system to be used for the primary output
positional fields in the query. The default is to use the same
system as the input coordinates, but an explicit selection
can also be made.
Output Format.
Selects the desired output format.
- Grid (+products). A sortable grid output that
includes product information. This format is not
recommended for large outputs of more than a few hundred
rows.
- Text: Aligned. A text table with all columns aligned displayed
as a pane in the Xamin window.
- Text: Streamed. A text table with no alignment. With
no requirement to align the columns the data
can be streamed immediately so that for very
large results this can be the fastest type. The
results will be shown in a pane in the Xamin window.
- Text: Aligned (new window). An aligned text result
shown in a separate browser window. This can be
convenient for printing.
- Text: Streamed (new window). A streamed text result
in a separate browser window.
- Text: Aligned (download). Download the data immediately
in the aligned format.
- Text: Streamed (download). Download the data immediately
in the streamed format.
- VOTable. Download a the Virtual Observatory VOTable format.
- FITS. Download a FITS binary table.
- Excel. Download an Excel .xls file.
Output content
These submenus help control what columns are returned
and the formats used.
Coordinate format
The user can either explicitly specify the coordinates
should be displayed in sexagesimal or decimal formats,
or use the coordinate based default: sexagesimal for J2000
and B1950 and decimal for Galactic and E2000.
Time format
Either ISO (YYYY-MM-DDTHHMMSS) or MJD formats (days including
fractional days) can be requested.
Fields Shown
The user may select to query only the Standard fields
in a table or look at All fields. When the user does
a single table query or a cross-correlation, the fields
to be returned are controlled by the Parameters Explorer.
This menu option controls only the initial configuration
of the Parameters Explorer and can be overriden by the user.
If tables are currently selected when this option is changed,
there will be no effect until the current table selections are
updated.
The Show position offsets controls whether the
calculated offsets between the user specified target and the row
is returned. This also controls whether the offsets between
tables in
positional cross-correlations are shown.
If more the user has made a positional query around more than
one target, then no offset will be shown. A given row may
be near multiple inputs. You can
cross-correlate with a list of targets to get the appropriate
offsets.
Check Show hidden fields to see certain system fields
that are normally hidden, notably a unique row identifier and the
position unit vector.
Correlations.
Users may correlate two to four tables using Xamin. To perform
a correlation just specify the tables you want to query. A
positional correlation constraint will be automatically added in
for each new table. Users can update and override this constraint
using the Parameters Explorer. E.g., the user can specify
a specific cross-correlation maximum offset.
The user
can choose to correlate on fields other than position.
If an positional correlation contraint was automatically generated
it can be deleted. Correlation constraints (e.g., matching
observation times or PI names) can be made either in the
constraint fields of existing columns, or by adding a general constraint
to the query. Both of these options are available in the
Parameters Explorer.
- Anticorrelate against last table. Check this box if you wish
to find fields in the earlier tables which do not match against
the last table. E.g., if you have selected rosmaster and chanmaster as your
two tables and you want to find targets seen by ROSAT that have NOT been
observed by Chandra.
- Anticorrelate against first table. Check this box if you wish
to find fields in the later tables which do not match against
the first table. In the previous examples this would give targets
seen by Chandra that have NOT been
observed by ROSAT.
Products and Links
These checkboxes select the products that
will be returned with the results.
Products are
visible only when using the default grid output.
- Archive products. Data sets linked to the tables you are
querying. Set by default.
- Table links. Table links are queries, within Xamin,
of tables with information that may be related to the
current table. E.g., a link may include data from
another mission in the same region.
- Bibliography. Published literature associated with a given
observation or table entry. This implicitly links with the
zzbib table to see if any of the observations
returned have corresponding entries there.
- NED/SIMBAD/SkyView links. Queries of popular services near
the position of a given row.
Query control.
Unlike the Output content menu described above which controls
the columns returned, these options control the overall query
and the rows that are returned.
- Distinct rows only. By default a query may show many
identical rows. E.g., you might have asked to see just the
instrument used by ROSAT in each of a set of observations. This
option suppresses duplicate rows so that you will get just one
entry. A common case for using this is when doing
cross-correlations where you do not wish to see any fields from
one of the participating tables. It is not enabled by default
since it can substantially increase query time.
- Survey Imgs. Set SkyView surveys that will be previewed
when you do a query that specifies a single position. A comma-separated
list of SkyView survey names should be given. The default is DSS,RASS
which gives previews using the DSS and RASS surveys.
Updating this will take effect the next time a query is run.
- Max Rows. Only show the first N rows in a query. Clear this
entry or set a negative value to remove the limit. Set to 0 to
suppress running the query. This can be useful if a user wishes
to check constraint syntax.
- Time limit. Set a time limit for the query. There are two
checks done here. Before each query is set an estimated time for
the query is calculated. The query will not be performed if the
estimate exceeds the time. When the query is started, a timeout
for the given limit is set and the query will be interrupted and
fail if it exceeds the limit. This limit applies to
activity on the server side. It does not include the local
rendering of large
grids. This can take a while and may exceed a specified
time limit.
Query info.
These options allow you to get additional information about the query.
The query data can usually be viewed in by clicking on the ? tool in
the query result pane.
- Time query. Show the actual execution time for the query.
Unlike the other data controlled in this menu, this is computed
on the client side and is the actual time between the initial
dispatch of the query and final receipt of information back from
the server. It does not include the time to render the result in
the browser.
- Show cost estimates. This will show the estimated cost for
running the query. This is extremely rough and includes only the
query cost, not the time for downloads or rendering.
- Show command arguments. The Xamin Web interface uses the
Xamin CLI libary. Show the arguments used in the underlying
query command. You can use this to help build scripts using the
CLI interface.
- Show generated SQL. Show the SQL generated for the query.
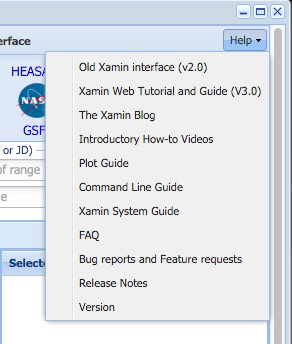
The Help Menu
This menu is located at the right of the menu bar.
It menu allows you to get to several different help resources.
- Xamin Web tutorial and guide. A link to this document.
- Xamin Blog. An blog discussing updates to Xamin
- Introductory How To Videos.
- Command Line Guide. How to get and use the command line version of Xamin.
- Xamin System Guide. An overview of the Xamin design and implementation
- FAQ. What users have asked before?
- E-mail comments. A link to the E-mail feedback.
- Bug report/Feature Request. The Xamin Feedback page.
- Release notes. Changes in the current version of Xamin
- Version. The current Xamin version (including its release
date)
The Actions Area
This area comprises three sets of buttons to initiate queries and to
reset areas of the query pane.
Query table[s]
These buttons initiate a query. Normally these buttons
are activated when the user has selected between one and four tables.
If a single table has been selected, then a single table query will
be run. If multiple tables are selected, then a cross-correlation
among the selected tables will be done. A positional offset
constraint will be automatically created between the first and
each of the other tables. I.e., only rows where the position offsets
are less than a default (different for different tables) will be
included. These can be overriden in the Parameters Explorer.
The Save as table option is only available if
the user has logged in.
Show table.
Display a result using the format specified in the Output format
menu item.
Plot
Prepare to plot the results from this query. The effect of
this is to create a Plot control pane where you can select
the columns to be plotted and other query options.
Save as table
Save the result of the query as a user table. The user will
be prompted for the table name. If the name of an existing table
is used, the Xamin will attempt to append the new results, but
the structure of the new table must be identical to the previous content.
Find Matches
The button in this section is used to initiate discovery queries.
If the user has specified position, time or bibcode constraints then a
user can ask to get a summary of which HEASARC tables have rows
that match these constraints and how many rows there are.
If the user has not selected any tables, then all HEASARC tables
are looked at. If the user has selected tables, then only
those tables are considered. The label of the button will change
to reflect the current status. Users can click on the
initial results for any matching table to get the actual results.
Clear ...
These four buttons on the other side of the Actions bar
are provided to clear/reset elements of the
query pane.
- Tables
- Deletes all entries from the selected tables tree. It does
not reset the Available tables (e.g., if the user has opened
a branch in that tree it remains open).
- Constraints
- Remove all user specified constraints: user entered
positions and times and any constraints the user may have
added in the Parameters Explorer area. It does not remove
the system generated cross-correlation constraint between
tables when the user has specified a cross-correlation.
- Options
- This resets all menu options to their default values.
- All
- Equivalent to doing all of the other three.
Standard Constraints
Xamin recognizes three kinds of 'standard' constraints: position,
time and bibcode. Users can use these constraints to query
a specific table or table, or to do discovery queries to
find which if any tables have rows that meet these criteria.
Positions and Radii
Positions may be specified in a variety of formats, target
name, decimal degrees and a variety of sexagesimal formats.
Radii may be specified using degrees, arcminutes or
arcsecond units. The unit may be specified in the radius
string by appending the chracter d (or D), ' and "
respectively. This overrides the unit selection menu.
The initial default for radius units is arcminutes.
Multiple positions may be included in the position box
separated by semicolons.
Times
Times may be entered in ISO format
(YYYY-MM-DDTHH:MM:SS.ffff), Julian days or Modified Julian
days. The format of the date is automatically parsed to make
the selection. Many variations on the ISO format are
permitted. As users enter times, a red boundary indicates
that the format of the data is not recognized. Fields for
both start and stop times are available. It is an error to
specify a stop time without a start time, but specifying a
start time alone is allowed and represents an instant in
time.
When making queries of tables that have only a single time
specified, Xamin normally looks within 0.5 days of the
specified time for each row in the table.
The Tables and Parameters Explorers
Xamin provides a Tables Explorer to find tables to query,
and a Parameters Explorer to specify columns and constraints
to query after a table (or set of tables) has been selected for
a query. When Xamin starts up the Tables Explorer is displayed.
After you have selected a table or tables, you can activate
the Parameters Explorer by clicking on the bar just under the bottom of the
Tables Explorer. To return to the Tables Explorer just click
on the Tables Explorer bar. Only one of the explorers can be
open at a time. Click on the bar associated with the closed
explorer to open it up.
The Tables Explorer
This region is used to discover and select the
tables that are available in Xamin. There are
four main ways to select tables. Users
can enter table names directly, they can use the
one of several trees to select tables, and they
can search for tables that match keyword criteria and
then select tables of interest from a matching tables pane.
Finally they can upload
a table directly into a query, even without logging in.
What tables are in Xamin?
Xamin allows users to select from from four different sources of tables: HEASARC tables,
VizieR tables, tables accessed through VO protocols, and user tables.
In principle tables from all sources can be matched and correlated, but
users should be cautious when attempting correlations with external (non-HEASARC) tables
since these may not be feasible if they require downloading and ingesting
very large external tables. E.g., one can in principle correlate with the
USNO B catalog at Vizier (table I/284).
This has hundreds of millions of rows.
If one tries this without
specifying a position, then program will try (and fail) to download the entire
USNO B to a temporary table within the local database to do the correlation.
HEASARC tables
The HEASARC provides direct support for about 800 tables. With a few exceptions tables
are entirely independent, i.e., no special correlations are anticipated
with other tables. Many of the most popular tables index archives from
high energy or microwave missions. These tables often provide links to archival
data products which the user can select, add to a products cart and download
in a variety of fashions. Most other tables are object catalogs, which
describe the characteristics of objects in the sky. Occasionally these will
have data products as well.
HEASARC tables may be entered directly. When typing in user names
possible completions will be shown and may be selected. HEASARC
tables are available through a variety of table hierarchies (alphabetical,
by mission, by regime, and by object type). The keyword search
will find HEASARC tables whose metadata matches the search terms.
Documentation on a HEASARC table can be displayed in the Information pane
by clicking on the table name.
VizieR tables
VizieR tables are available in the in the Tables Explorer hierarchies under
External/Vizier. Over 20,000 distinct tables may be queried. Vizier tables
are grouped into resources which are in turn grouped into either broad categories (given by Roman numerals) of tables
where the name is the Roman numeral followed by an identifying numeber (e.g., I/284 is the USNO B catalog), or by a
journal abbreviation followed by the volume and page of the article in which
the table was published, e.g., J/ApJ/597/204. A resource may contain
either a single table or multiple tables. If there are multiple tables
in a resource, then a table identifier follows the resource, e.g.,
I/100A/w50 labels table w50 in the resource I/100A. Often tables within
a resource are expected to be joined in some fashion using ID's specific
to the resource.
You find Vizier tables in the table tree under External/Vizier. You can
enter table names directly, or you can use the metadata query to
match against Vizier tables. Vizier tables will not be returned in
discovery queries.
Many Vizier tables do not have positional columns. Vizier tables support
field selection, sorting and simple constraints natively. More complex
queries may require the Vizier data to be downloaded into a temporary
local table where the complex constraints can be addressed. No data products
are associated with Vizier tables.
Documentation for Vizier tables can be displayed in the Information pane
by clicking on a table or resource name.
Virtual Observatory Tables
You can access data through several VO protocols using Xamin. The Table
Access Protocol provides access through services that provide relatively
sophisticated local queries. Most constraints on a table can be handled
natively. Image and Spectral data may be accessed using more specialized
protocols. These only support positional constraints natively. All other
constraints are implemented by downloading the results and filtering the
temporary table.
Image and spectral services generally provide a link
to a single product for each row in the returned results. Since this
is a link and not an archive file they cannot be added to the download cart.
VO resources can only be accessed through the table tree in the
External/Queryable tables, External/Image services and External/Spectral
services entries. These link to services the user the VO Table,
Simple Image, and Simple Spectral Access protocols respectively.
No documentation is avaiable for VO tables other than the
row documentation available in the Parameters explorer.
User tables
Users can upload tables from their computers to be used in an Xamin query.
Without logging in, users can upload a single table, but if a user has
logged in any tables saved in previous or the current session
are appended at the end of the table tree. These persistent user tables
are created either by uploading a table or saving a query result.
User tables are only available after logging into a user account.
Persistent user tables may be specified by either entering the full table name
(in the form user.table) directory or by selecting them under
the User entry in the the table tree.
No documentation is available for user tables other than the
row documentation available in the Parameters explorer.
Entering tables directly
The tables entry box allows the user to type the table in
directly. It also allows selection from a menu which shows
all HEASARC tables which match whatever has
been entered so far. Note that VizieR tables
can be entered but are not included in the menu
suggestions.
The available tables tree
The available tables tree shows tables available for
querying in a number of hierarchies, including alphabetical,
mission, regime and object type. Only HEASARC tables are
shown in these hierarchies. An External tree shows known
external tables. If the user has logged in and has uploaded
or saved tables, these tables will be shown in the User
tree. Trees may be opened or closed and either leaf
nodes -- tables -- or entire branches may be selected by
clicking on the Add icon or double-clicking on the node, or
dragging the name of the node into the selected tables area. Tree
nodes may only be selected when the Add icon is present in the node.
Table Keyword Search
The table keyword search does a text search of the
documentation for HEASARC tables and indexed external
tables. The text search handles grammatical transformations
(e.g., singulars and plurals) and attempts to grade each
match to show the best matches to the user's input. The
results are shown in a pane with the table name and title
and brief extracts of the matching text. Note that the table
metadata is included in the text search so that occasionally
the apparent matches may includes somewhat jumbled text.
See the documentation of the Matching Tables pane for more information.
The selected tables tree
Regardless of how users select them, selected tables are shown
in a separate tree. Users can delete tables by using the delete icon ( ) or double
clicking on the table.
The entire set of selected tables can be cleared using the
) or double
clicking on the table.
The entire set of selected tables can be cleared using the Clear...Tables0
or Clear...All buttons in the Actions area of the Query pane.
If the user selected a sub-tree of tables,
then the entire subtree will be shown in the selected tables
tree, including the branch nodes. The entire subtree may be
deleted by deleting the parent node. E.g., you could select all
of the Observation master tables by clicking on the Add icon
in the available tables tree. A 'Master observation tables'
node will be added to the selected tables tree. Deleting
that node will deleting all of the contained tables.
If no tables are selected the user may make discovery
queries which search all HEASARC tables.
If more than 4 tables have been selected then only discovery
queries are supported. [Generally correlations get very slow
when many tables are involved.] Note that user and external
tables are not currently 'discoverable' so that you cannot
determine the number of matches against them using a
discovery query. When doing a discovery query they are
ignored. Only the number of matches against the specified
HEASARC tables will be returned.
If exactly one table is selected, queries will be made of
that table. The user may specify positional, temporal or
parameter constraints in the query (using the additional
constraints area).
If 2-4 tables have been selected then the user may do either
discovery queries looking for the number of matches for the
specified positions and/or times for these tables, or they may do a
correlation of the selected tables depending upon which
button they click in the Actions area.
If an Options/Correlate/Anticorrelate flag
is set, then a correlation is done as an anticorrelation against
the last or first table selected. E.g., if the selected tables are
rosmaster, ascamaster and chanmaster,
then you can get the results of matching ROSAT and ASCA observations
in regions where there is no nearby Chandra obervation.
External tables
Xamin attempts to treat external tables as if they were
local. If the user requests operations (constraints that
cannot be met by the remote system or correlations), then
there may be an operation downloading the external table
into the local system after which the query can proceed. As much of
the query as can be accomplished remotely will be delegated
to the remote system. However it is not difficult to submit
queries which would involve downloading millions of rows of
the external tables. Such queries are unlikely to be
successful.
Using the Tables Explorer upload
Starting in Xamin version 2.8, users can upload tables into queries
without having to log in. Use the file selection widget in the
upload feature to select a source list, CSV file or VOTable to be
uploaded. When you select a file,
the table 'Upload' will appear in the selected tables list. You can clear
the upload using the button next to the file selection widget or by deleting
the Upload table in the selected tables tree.
Uploaded tables are mostly treated just like other tables. You can
make selections based upon the fields in the table and do correlations
with other tables. E.g., if you want to find all of the XMM observations for
a list of objects, then create a source list for this list, and you can correlate
the upload with the XMMMaster catalog.
Files can also be uploaded using the Upload option in the Session menu, but users
need to be logged into an Xamin account.
There are some limits on queries when you use the upload capability of the
Tables Explorer. The Upload table is always the last table in the query.
You can only upload a single table in a given query.
Plotting functions are not supported, and you cannot save the state of the
query form. These limits arise the nature of how files are uploaded in
from Web forms. However none of these limits apply to files you uploaded into
your Xamin user area. When loading into the user area you can also use characters other than commas
as the delimiters in CSV files.
The Parameters Explorer
Use the parameters explorer area to see the fields available for
the selected table (or tables), add any constraints
other than the standard position and time, and specify the output fields
Users can also
add dynamically computed columns and specify the sort order
for the query.
The parameters explorer is only available for
single table queries or for correlations. It is reset every time you change the
selected table or tables. To open the Parameters Explorer simply click on the
its title bar. The parameters explorer is not enabled
until one to four files have been selected.
Table fields
Most of the Parameters Explorer is taken up by a
grid showing the fields of the input tables. There are five columns shown
by defaults. You can click on the a header to control which columns are shown.
Fields are shown in the order in which they will be displayed in
the results, with all the fields that will be shown first, and fields
that are not currently to be shown at the bottom. You can click on the Delete (-)
icon next to fields that are being shown to hide them, and on the Add (+) button
to add hidden fields to the query results. The affected fields will
be moved to the boundary between shown and hidden fields.
The default columns are:
- Selectors
- Name
- Constraint
- Format
- Description>
Additional fields can be displayed by clicking on any of the column
headers and checking the boxes next to Table/Unit/Minimum/Maximum/UCD/Display.
The first column has two icons which can switch whether
a field is to be shown. Users can click on the +/- icons
to either add or delete fields from the set of displayed fields.
When a single field changes status it becomes either the last
field displayed, or the first field not displayed.
Users can also click on the > and < icons. If the column
was originally to be displayed, then that column and all columns
below it are no longer displayed. If the column was originally
hidden, then it and all columns above it will be displayed.
Users can select rows and ranges of rows and drag and drop
them to alter the order in which columns are to be displayed.
The second column is the name of the field.
The third column is is a constraints area. Users can
enter constraints that will be placed on the field by
typing in this area. Typical constraints as entered might be:
- >100
- Only return rows where the value of this
column is greater than 100.
- 3c*273
- This might be entered to search a name field
for the object 3c273. Whenever a string is
entered in a text field, the interface will
automatically surround it with single quotes
unless the user enters them explicitly.
Thus this entry will be converted to '3c*273'.
Occasionally a user may wish to do a comparison
to another character field. E.g., perhaps we
want to do a correlation where we want the
same observer in both fields. After we enter
a.observer in the constraint area, Xamin will
automatically add quotes to make this 'a.observer'.
The user can delete the added quotes. Xamin only
adds quotes when the field was originally empty,
so it won't re-add the quotes.
- 1.5 .. 1.8
- Looking for a range from 1.5 to 1.8 inclusive.
- spectra;images
- Assuming this is a character column the ; will
be treated as a separator and this will look for
rows where the value is either 'spectra' or 'images'.
Automatic quoting will turn this into
'spectra';'images'.
- >a.mag-2
- A constraint can refer to any field in any of the
tables in the query. Here it refers
to the mag field of the first table in the query.
In a text comparisons a '*' may be used as a wildcard match
along with the SQL standard '%'. Text comparisons are
generally not case sensitive. A case sensitive comparison
may be made in a table by specifying a generic
constraint (see below) rather than associating
it with a particular column.
Adding new fields and constraints
The User-defined column button allows the user to specify a
new field to be included in the output. Any name may be
given for the field. The content of the field is given as
any legal SQL expression. This may include one or more
fields in the table and may include any SQL functions supported
by the database.
The Generic Constraint button allows the user to specify a
logical SQL expression which must be satisfied for a row to
be included in the output. Since these constraints are not
associated with specific fields in the table any actual strings
must be delimited by single quotes. A string
comparison will normally be case sensitive unless the user
explicitly addresses case in the expression (e.g., by using
the upper() function on both sides of an = operator).
Sorting
Users may specify the sort order for the results using the
Sort combobox. Users are prompted with the names of the
fields in the table, but sorting may be done on any
expression. If multiple sort fields are requested, these may
be specified with the names separated by commas.
E.g, expr1[:-],expr2[:-]
where the default direction for each field is ascending. A
:- is appended
to make it descending.
Aggregate operations and groups
The Xamin interface supports aggregate functions -- one of the
more advanced features of SQL -- in a straightforward way.
Suppose you want to know the total exposure for each Chandra
target. We put the target name and a new synthetic column
with the expression sum(exposure) as the only two
fields we are going to output. Xamin notes your use of an
aggregate function in the new column and groups the output
by any parameters which are not aggregate functions. So you
get one row output for each distinct target name. The
aggregate functions available include count, sum, stddev,
variance, min and max. Rows where the argument of the
aggregate function would be null are omitted from the query.
The Information Pane
This pane is used to display information about tables or
classes of tables. If the user clicks on a table entry in
either of the table trees or in the keyword search pane, the
documentation for that table is shown. If the user clicks on
a branch node of a tree, then the information shown depends
on the node. Typically if these is a penultimate node, i.e.,
its children are tables, then a summary listing of the
contents will be shown. Tables can be selected from this
listing by clicking on the Add icon.
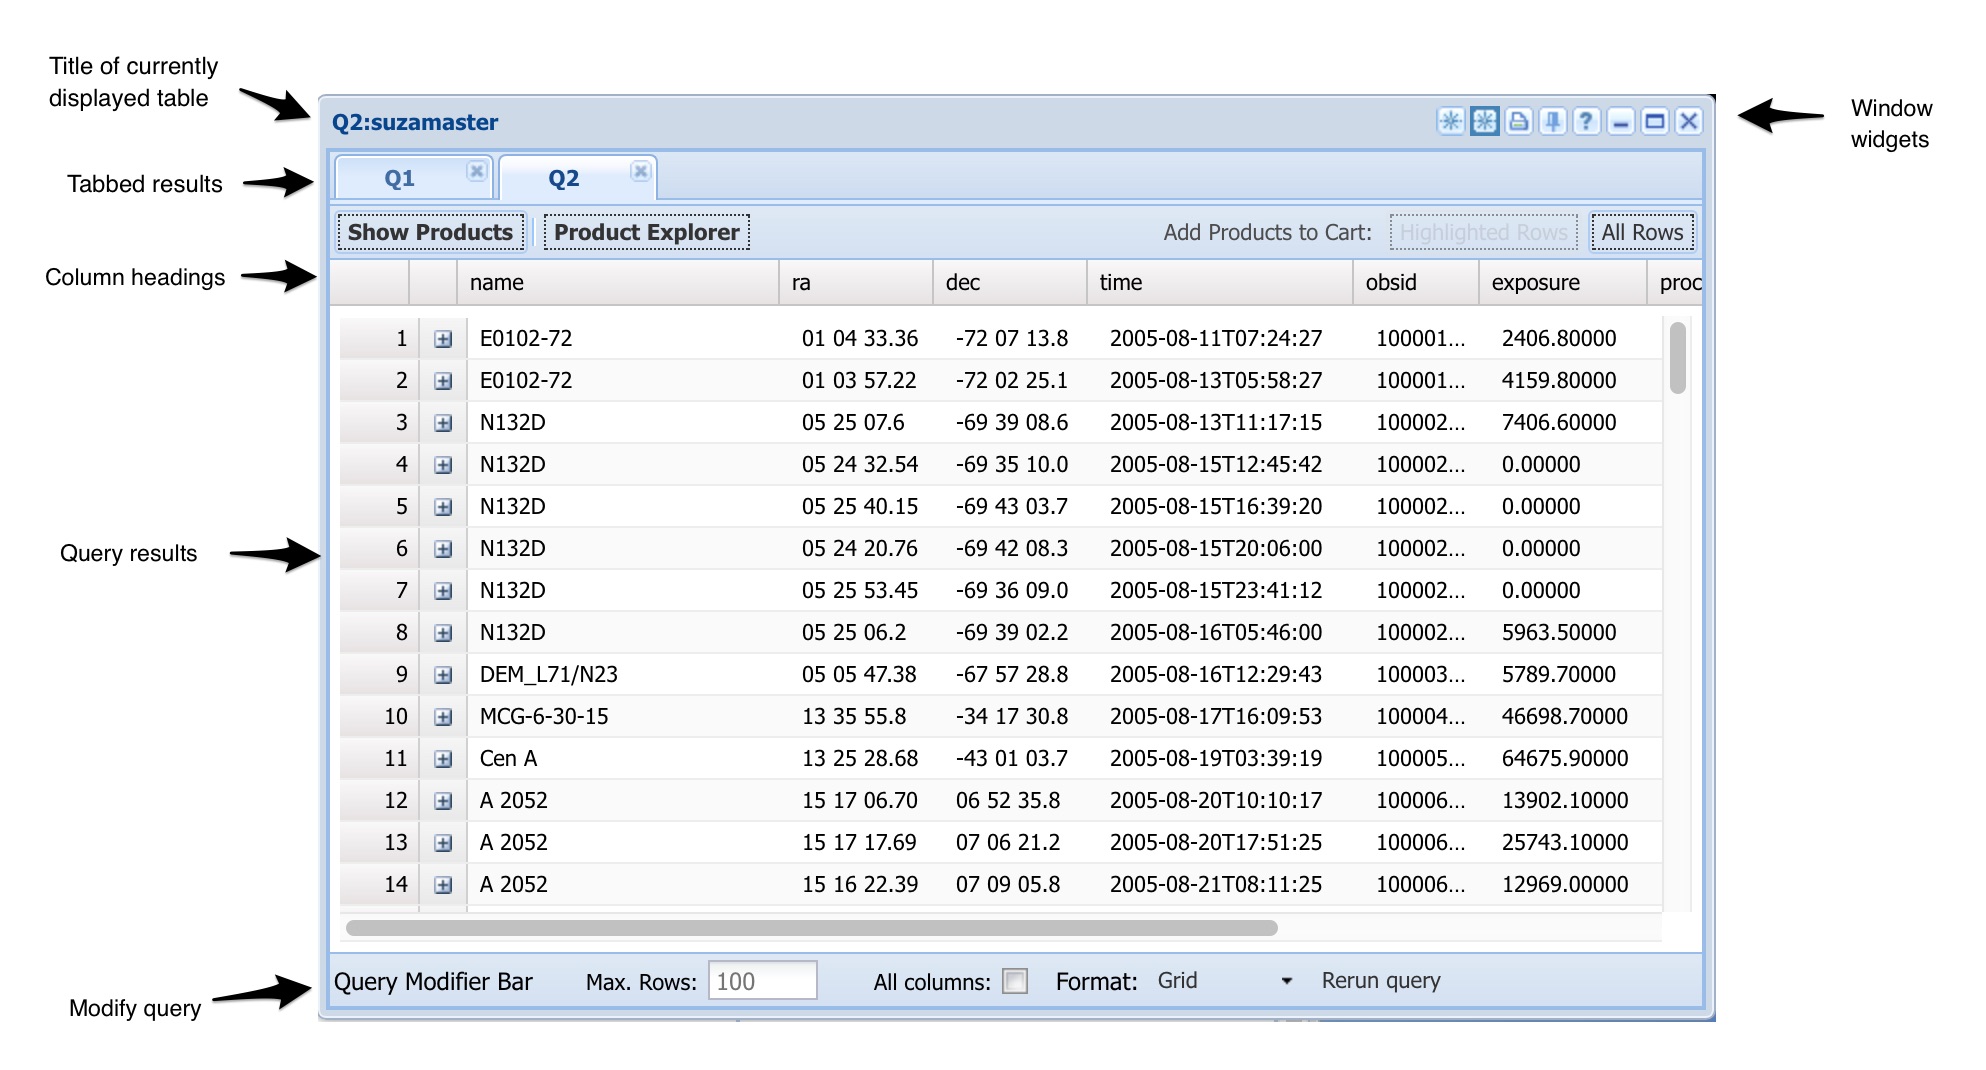
Table Results
A new table results pane is shown for successful queries in a tabbed panel.
The title bar includes the source table (or tables) for the currently
displayed tab and may give further information about the query. The
bottom of the query box includes fields that may be used to reissue the
query changing like the maximum number of rows, or the output format.
At the top right of the query box are several query widgets. These
allow the user to restore the query pane to the settings used
for this query, to print the query results and to get further
information about the query. There rightmost X widget destroys the
results pane. The two left most widgets are used for updating
the Aladin Mapper pane.
Grid results
Grid results within each tab are shown in a flexible output format. Users
can resort the data by clicking column headers on the top
row. Column headers can also be dragged to reorder the
columns. If you click on the column header a small menu is
shown which allows you to select which columns are to be
shown. Grid results may also include data products.
For most grids, mousing over the column headers will show the
descriptions given for the columns in the documentation of the associated table.
Similarly mousing over the row number at the beginning of each row will show
all of the fields associated with that row. This is displayed in a persistent
pane that the user must explicitly dismiss.
Text results
Text results are shown in a simple pane with no special formatting.
Text results can be striped and render much faster than grid results.
Text results do not show data products.
Discovery results
When doing discovery queries the user gets back one row for
each table that matches the specified position or time criteria.
Click on the row to initiate
a query of that table.
Products
Products are available when grid output (the initial default) is used.
If data products exist for any row there will be an
expansion icon in the second column. This icon (1) can be
clicked to reveal the top level of data products for that
row. Sub products can be retrieved and displayed by
clicking the expansion arrow icons (2).
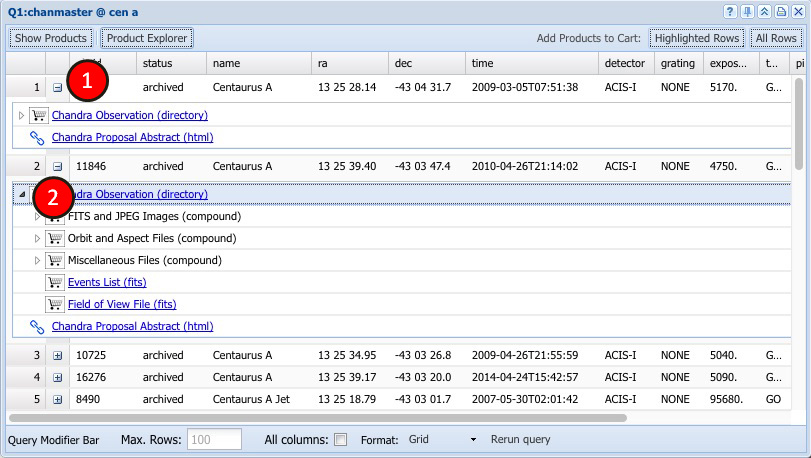
The data product selection buttons in the results pane allow
users to select data products for particular rows or the entire
result. If users have expanded a products tree they
can select products individually by clicking
on the shopping cart icon before a product. Users can directly
go to the URL associated with a product by clicking on the product
name.
After products are transferred to the shopping cart, users can
download products using its capabilities.
Aladin Mapper
The Aladin Mapper is an interactive visualization component using the
AladinLite data visualizer developed at the Centre de Données
astronomiques de Strasbourg (CDS). This new feature allows users to
select regions visually and to display the location of observations and
targets against images of the HEASARC archive holding. User can also
select an area within the Aladin widow to transfer coordinates to the
Xamin window for a new query.
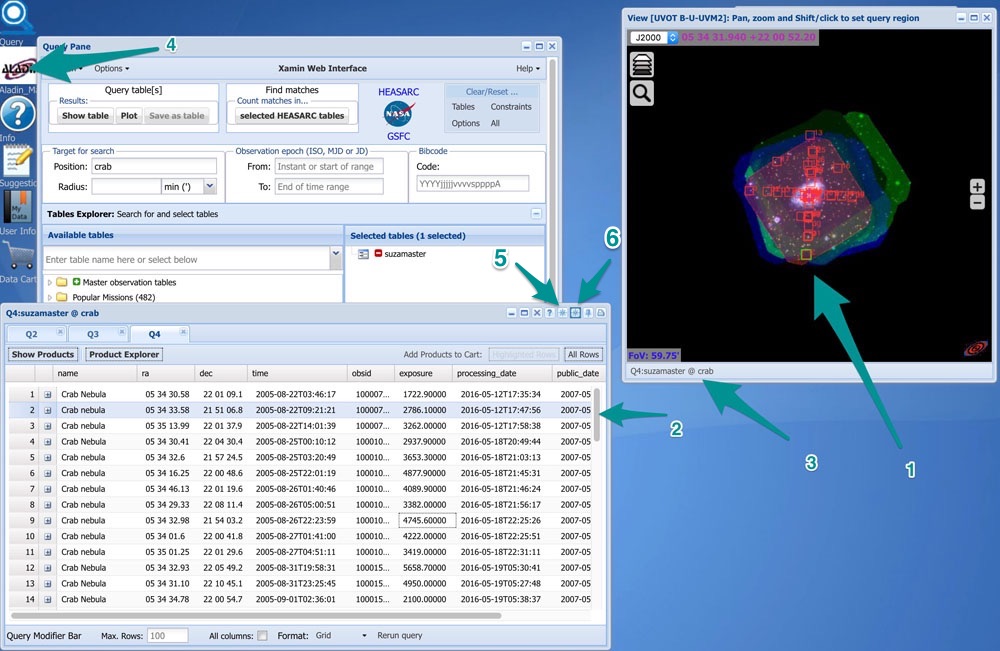
Positional grid-formatted queries will trigger the associated region
and query results to be displayed in the Aliadin Lite window (below).
Results will be shown as markers on the image.
Selecting a row in the results grid highlights the element in the
Aladin window and vice-versa. (1, 2). Users can immediately determine
the identity of interesting objects, or pick out objects with special
non-spatial characteristics. The bar below the image window (3) shows
the title of the associated grid. Clicking the Aladin icon (4) on the
desktop will redisplay the Aladin window and bring it to the forefront.
Clicking the Update icon (5) will replace the markers in the Aladin
window with currently displayed query results. Clicking the Restore
icon (6) will return the Aladin window to the initial state of the
displayed query results.
Different background image data can be selected from a list of
missions (figure 2). A shift-click in the Aladin window (figure 3)
will encircle the clicked position (1) and transfer the center
coordinates and radius of the enclosed circle to the Xamin window (2)
in quick preparation for a new query.
The Shopping Cart
The shopping cart pane is used to control the actual download
of data to the users machine. Users can send products to the shopping
carts throughout an Xamin session and download data whenever they wish.
Products are transferred into the cart from table panes when
users request the data products associated with particular rows, or select individual
data products.
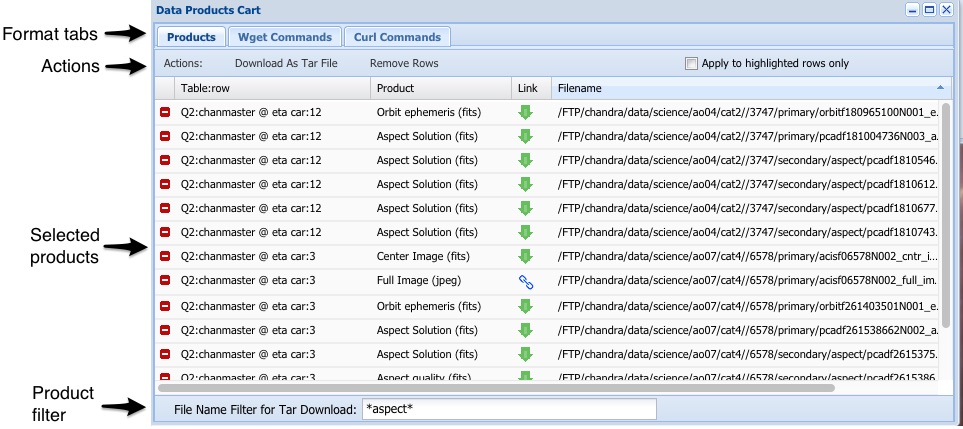
The products cart has three tabs. The products tab
provides a listing of the data products where users can
delete products (or jump to them as URLs). This is the
only tab in which products may be deleted. Users can delete
all products, or just those that have been highlighted (by clicking on
them) using the appropriate buttons.
The WGET tab allows the user to download scripts that they can
run on their machine to access data, but do not
allow a user to delete selected products.
Filtering Data Products
For all download options a filter using the Unix shell
wild-card expressions (e.g., *) can be applied to limit the files that are
downloaded. Enter a filter string in the File Name
Filter for Download text area. The filter is
applied to the full path name. For example, the filter
*/bat/*.hk* would limit data products to those that are
under the directory bat and contain '.hk' in a subdirectory
or file name. A file such as
/FTP/swift/data/obs/2005_04/00035014004/bat/hk/sw00035014004bdp.hk.gz
would be included. Multiple contraints separated by a
semicolon (;) will be treated as boolean OR. So,
*fits*;*gif* will result in products with names containing
'fits' or 'gif'. If the filter results in no files being
found the downloaded tar or script file will indicate this
result.
Finding Wget and cURL
The network utilities Wget or cURL are included with most
systems. To download Wget or get more information visit
the GNU website. cURL commands are no longer provided because cURL does not support downloading directories. If your
shell is Bash, this script will allow you to download directories using cURL:
`for file in $(curl -s https://heasarc.gsfc.nasa.gov/{FTP_PATH_HERE} | grep href= | sed 's/.*href="//' | sed 's/".*//' | grep -v '^/'); do curl -s -O`.
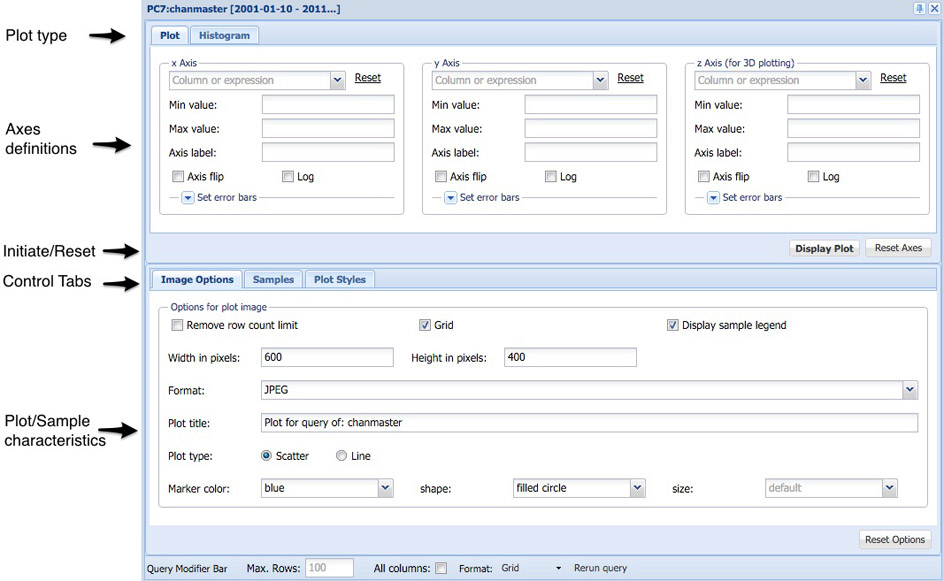
Plot Control
The options for plotting are sufficiently complex that a
separate Xamin Plot guide
is provided to describe how to do plotting.
The plot control pane allows the user to
select among histograms, 2-d and 3-d plots, set the axes for the plots
and myriad of axes and plot parameters. Users can also plot multiple
samples within the plot. Use the Sumbit button on the plot control
pane to generate a plot.
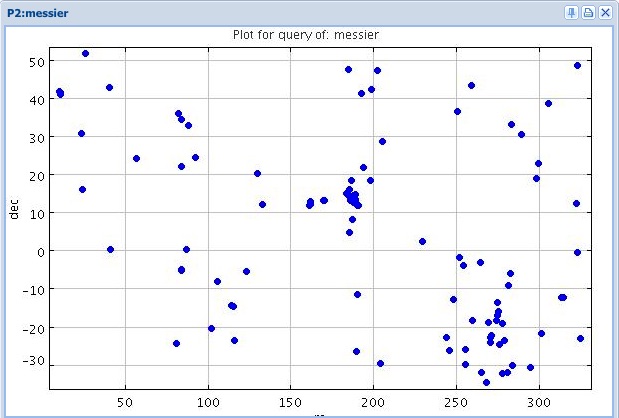
Plot Results
Plot results panes simply enclose a GIF or other format
image. They have no internal functionality although they have
widgets similar to the query table result panes.
User Accounts Pane
The user account pane is shown when a user logs in or
using Session/User Tables--Info menu entry.
This pane shows the saved user tables and query configurations.
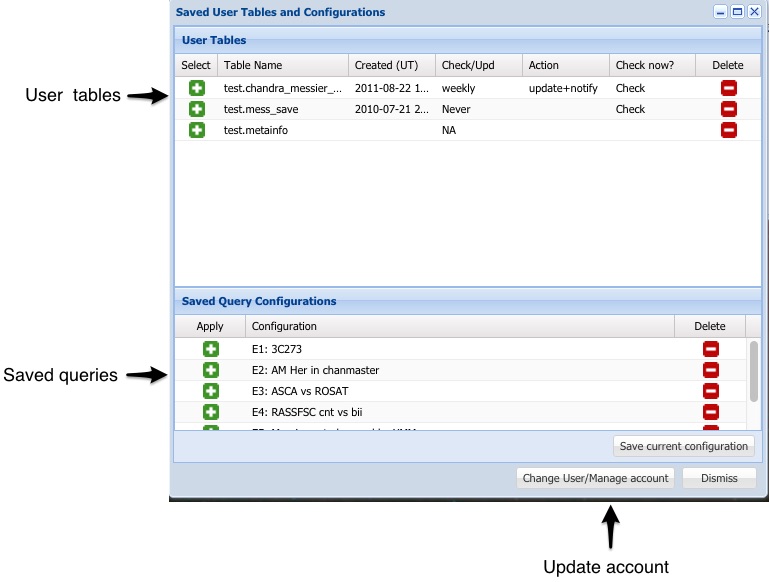
The title bar of the pane shows the user's name, and the amount of space
used in the Xamin system. Currently no quota's are enforced but this
is likely to change in the future. Two grids display the tables the user has
saved and the saved query configurations. A Manage Account button provides
a shortcut to the Login window where the user can update their account
parameters, or delete the entire account.
Saved Tables
Users can save tables either by uploading them (Session/Upload),
or using the Query to...Save
option to run a query. Saved tables can be used just like system tables
in any query or
correlation. You can select a saved table for querying using the Add icon ( ).
Two saved tables can be correlated against one another.
This delete icon () can be used to delete a saved table. For non-uploaded tables
users can click on the entry in the 'Offline checks?' column to ask that the
system reissue the query and see if it returns the same results. If not then
the user can request that they be mailed a notice of the changes, have the
table updated or both (the default). The 'Changed' link at the end of the row
allows the user to check immediately whether the results have changed, but only
a simple summary will be given.
).
Two saved tables can be correlated against one another.
This delete icon () can be used to delete a saved table. For non-uploaded tables
users can click on the entry in the 'Offline checks?' column to ask that the
system reissue the query and see if it returns the same results. If not then
the user can request that they be mailed a notice of the changes, have the
table updated or both (the default). The 'Changed' link at the end of the row
allows the user to check immediately whether the results have changed, but only
a simple summary will be given.
If the user specifies a table that already exists when upload or saving
a table, then the results of the upload or query will be appended to the
existing table so long as the query fields are compatible. Otherwise the
query will fail.
Saved Query Configurations
Queries can involve complex setup which users may wish to repeat with slight
changes. A query configuration can be saved using the Session/Save Session
menu. Click on the Add icon link to restore the session state. Saved configurations can
be deleted by clicking on the delete icon ().
Note that a single session can be saved as a browser cookie using the Session
menu. This is not listed here and due to the size limits for cookies
this cookie is typically limited to menu option defaults.
Feedback
A feedback pane available by clicking on the mail icon in the Xamin
window background or using the Start button
button.
Users can send bug reports, suggestions or comments. Only
the title and summary fields are required, everything else
is optional. The system automatically appends a copy of the
state of the system at the time of the request which may
help in tracking down bugs. You can also view reports sent in by others.
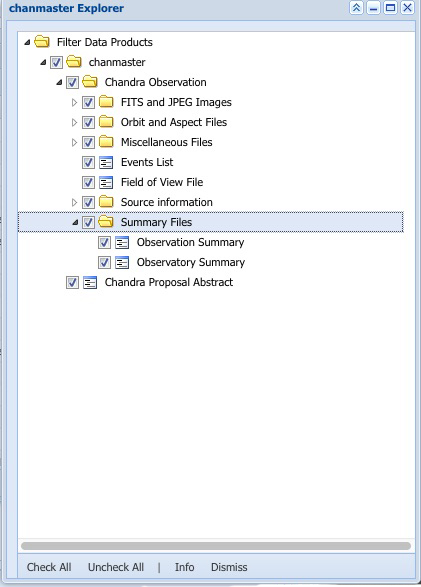
Product Explorer
Product explorer panes allow users to see and select the
kinds of products associated with particular tables. A given table may have
a whole hierarchy of data products associated with it. If a user wishes to
retrieve all data products associated with the table, they can just download
everything, but the product explorer panes allow users to select only subsets of
the products for subsequent requests.
A product explorer pane is created when users select the Product Explorer
button in grid table result.
A product explorer pane is associated with a specific table or correlation.
Users can select the products they wish to extract from a tree of avialable
products. The product selections will be applied to future queries of associated tables
and unexpanded rows in current grids. To apply Product Explorer changes to current grids
use the Rerun Option located at the bottom of the grids.
Pane Management
Xamin can produce many panes within its window. For each major
pane (i.e., excluding dialog boxes and such) a button is created in the
the task bar at the bottom of the Xamin window. You can click on this
button to render and hide the pane, and to move it to the top
if it is partially or wholly hidden by other panes. Click on the Start
button in the bottom left to get a menu that includes options to
hide or delete all data windows (table and plot results) or to organize
them in a regular pattern.
Some major panes: the query, information, feedback and user panes, can
also be rendered or hidden using icons on the upper left of the virtual
console as well as through the Start button.
All panes can be closed by clicking on the X in the top right. This
delete data panes, but just hides persistent panes. These panes
can be brought back and will show the same state.
The Single Box Interface
Xamin provides support for initiating queries using a single input box.
The single box interface is intended to be plugged into other pages to
provide a low profile interface to the HEASARC archive.
An annotated version
of the single box interface is available.
However the only required element for an implementation is one text entry box. When
a user initiates a query from this interface the inputs are analyzed and an Xamin
session is started.
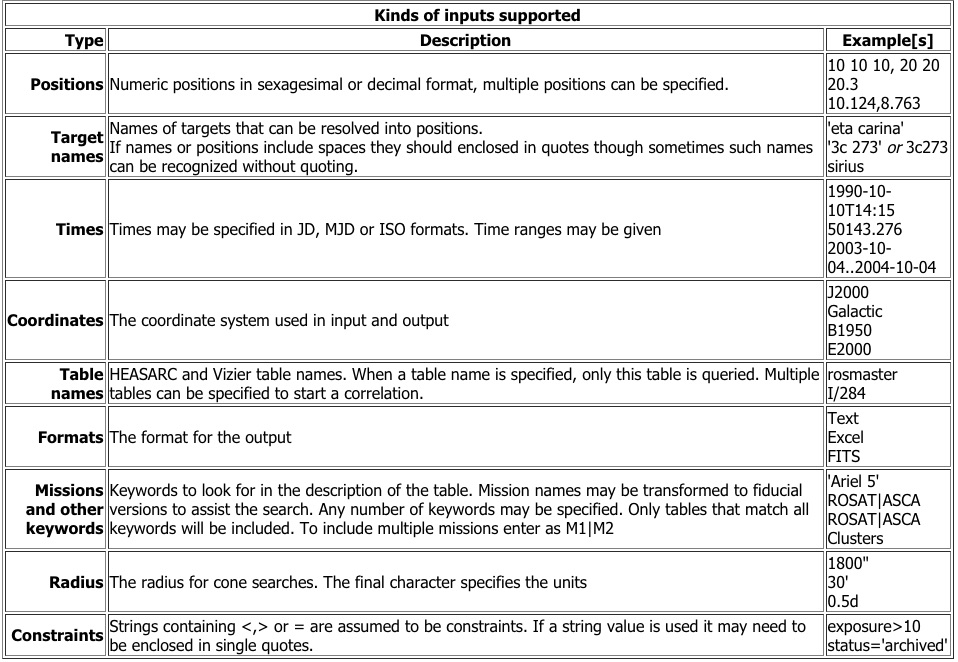
Single Box Inputs
The single box interface parses the users inputs into blank separated tokens
and uses a set of heuristics to decide what each token means. Supported token
types include:
How are the tokens used?
Target names, coordinates, time and radius constraints are used to fill in the
standard constraints in the Xamin query form. Maxrow, output format and coordinate
system tokens are used to set the appropriate menu options. If one to four tables have been specified then the query is assumed to be a
single table query or correlation and any specified explicit constraints are added as if they had
been specified in the Parameters Explorer. If no tables or
a large number of tables are specified, then a discovery query for the
given positional and time constraints is initiated and
any explicit constraints are ignored.
If no tables are specified, but there are keywords, then tables matching
those keywords are found and if there are position/temporal constraints
a discovery query on the tables matching the keywords is done.
Users are left in an Xamin session using thee standard web interface. Depending
upon their inputs they may find themselves with a set of tables matching
their keywords, a discovery query result, a single table query or a correlation.
They can extend or correct the actions that were taken and do further analysis.