![]()
![]()
[ Up ]
The purpose of this effort is to use the core suite of ClassX classifiers to produce estimates of the X-ray object class for each of the sources listed in the ROSAT RASS and WGACAT catalogs. This page presents a summary of what was done, and presents the initial version of the results.
The draft of our first ClassX paper, submitted to ApJ on Thursday 19 February 2004, is available in PDF and TeX formats. Additionally, here is a PDF version of Anatoly and Bob's paper on the detection of XRBs with ClassX.
The ROSAT All-Sky Survey (RASS) contains all of the observations from the survey-phase operations of the PSPC (Position-Sensitive Proportional Counter) instrument. This data is divided into two catalogs: the Bright Source Catalog (BSC) contains 18806 sources, and the Faint Source Catalog (FSC) contains 105924 sources. The published versions of these catalogs do not contain classification information for any of the sources. However, in August of 2002, Wolfgang Voges provided the ClassX team with classifications for a subset (6915 sources) of the RASSBSC.
The WGACAT (White-Giommi-Angelini Catalog) contains a list of sources derived from the pointed-phase operations of the PSPC. The published version of this catalog contains 88579 sources. Of this set, a subset of 14726 classified sources were used for classifier training. The WGACAT sources sample a fainter range of sources than the RASS due to the generally longer exposure times used during pointed-phase observations.
The RASSBSC and WGACAT data were used to train two families of classifiers, each with two members. Classifiers are distinguished based on the data they use to perform the classification of the inputs.
For each source catalog, two classification lists were produced. The first list uses unweighted voting. In unweighted voting, each source is classified by each classifier, and the output class which occurs most often in the aggregate results for that source is selected as the canonical class for that source. In case of a tie, the class with the highest total classification probability is selected. In case of a continued tie, the first encountered class is used, but I believe this case is quite rare. In weighted voting, each source is classified by each classifier, and the output class with the highest aggregate classification probability is selected as the canonical class. In case of a tie, the class with the most votes wins. In case of a continued tie (again, rare), the first class encountered is selected.
The highest-confidence classifications were then computed in a simple fashion: sources for which class voting was unanimous were selected as high-confidence sources.
RASSBSC classifications (unweighted voting)
RASSBSC classifications (weighted voting)
RASSFSC classifications (unweighted voting)
RASSFSC classifications (weighted voting)
WGACAT classifications (unweighted voting)
WGACAT classifications (weighted voting)
Best RASSBSC classifications (unanimous vote)
Best RASSFSC classifications (unanimous vote)
Best WGACAT classifications (unanimous vote)
Best RASSBSC classifications (unanimous vote), with original classes
Best RASSFSC classifications (unanimous vote), with original classes
Best WGACAT classifications (unanimous vote), with original classes
The following table links to Postscript-formatted tables of the original classifier output files for each catalog and classifier.
| Classifier | ||||||
|---|---|---|---|---|---|---|
| Catalog | RASS-X | RASS-XOR | WGACAT-X | WGACAT-XOR | ||
| RASSBSC | Output | Output | Output | Output | ||
| RASSFSC | Output | Output | Output | Output | ||
| WGACAT | Output | Output | Output | Output | ||
The following table links to the original classifier output files for each catalog and classifier. Each file starts with a header line, and the subsequent records are of the form:
ID|OC1\tP[1..n]\tClass
where ID is the original source ID, OC1 is the index of the class assigned to the source, P[1..n] is a vector of normalized probabilities, separated by tabs, representing the confidence assigned by the classifier that the source is of the corresponding class, and Class is the output class string. '\t' is the tab character.
| Classifier | ||||||
|---|---|---|---|---|---|---|
| Catalog | RASS-X | RASS-XOR | WGACAT-X | WGACAT-XOR | ||
| RASSBSC | Output | Output | Output | Output | ||
| RASSFSC | Output | Output | Output | Output | ||
| WGACAT | Output | Output | Output | Output | ||
The following table links to the cross-classification matrices, including preference and affinity, for each catalog and classifier.
| Classifier | ||||
|---|---|---|---|---|
| Catalog | RASS-X | RASS-XOR | WGACAT-X | WGACAT-XOR |
| RASSBSC | Matrices | Matrices | Matrices | Matrices |
| RASSFSC | N/A | N/A | N/A | N/A |
| WGACAT | Matrices | Matrices | Matrices | Matrices |
The following table links to summary files for each catalog and classifier. These files contain, in order, the source ID, the classifier input fields (variable in number), the original class (where available), and the computed class. Links are also provided to XML files that define the order and contents of the classifier input fields.
| Classifier | ||||||
|---|---|---|---|---|---|---|
| Catalog | RASS-X | RASS-XOR | WGACAT-X | WGACAT-XOR | ||
| RASSBSC | Summary Format |
Summary Format |
Summary Format |
Summary Format |
||
| RASSFSC | Summary Format |
Summary Format |
Summary Format |
Summary Format |
||
| WGACAT | Summary Format |
Summary Format |
Summary Format |
Summary Format |
||
The following table links to the output class distributions for each catalog and classifier. That is, when the given catalog is run through the specified classifier, the resulting classified sources exhibited the given distribution.
| Classifier | ||||||
|---|---|---|---|---|---|---|
| Catalog | RASS-X | RASS-XOR | WGACAT-X | WGACAT-XOR | ||
| RASSBSC | Distribution | Distribution | Distribution | Distribution | ||
| RASSFSC | Distribution | Distribution | Distribution | Distribution | ||
| WGACAT | Distribution | Distribution | Distribution | Distribution | ||
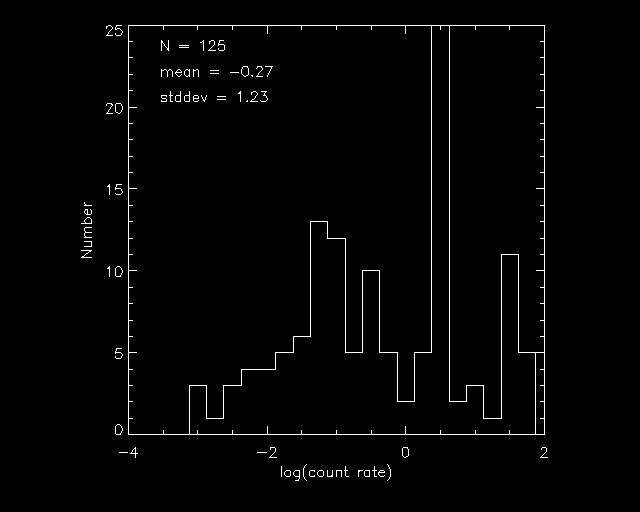
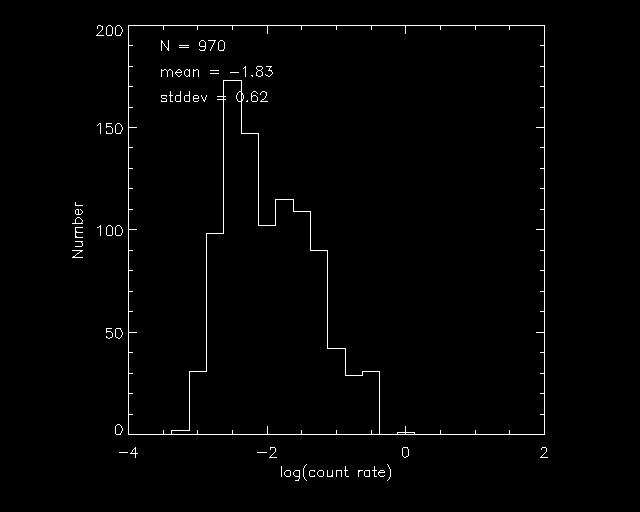
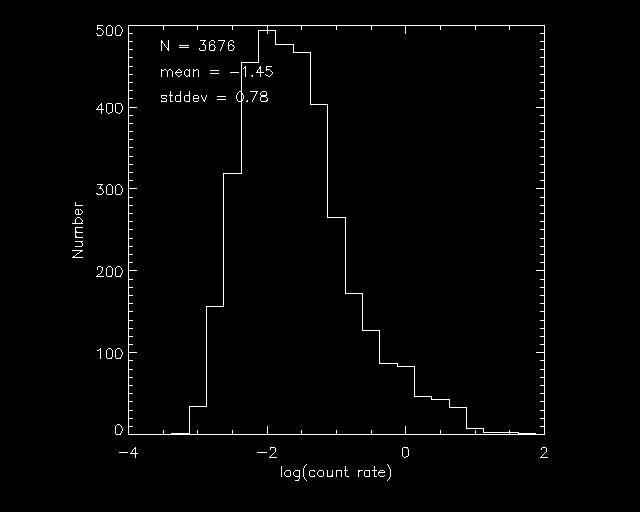
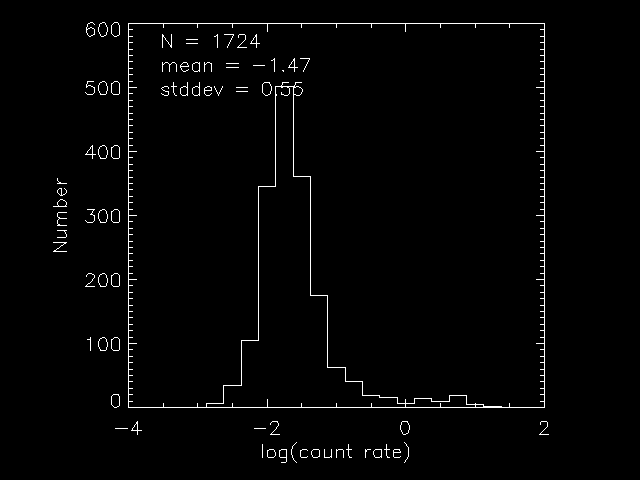
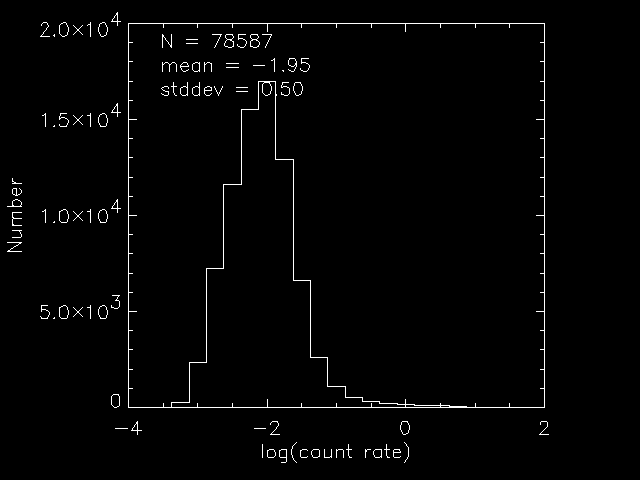
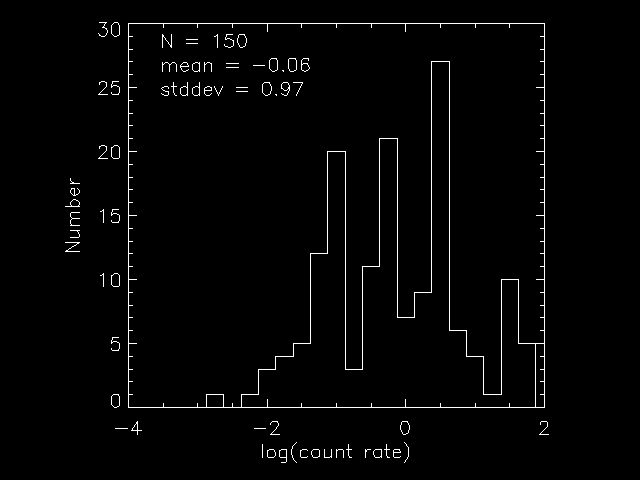
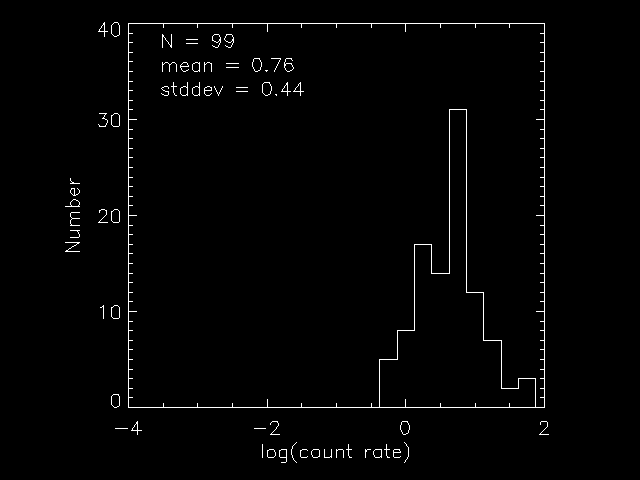
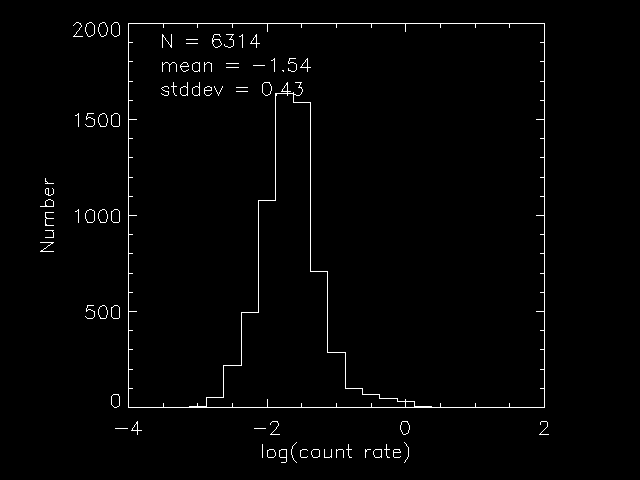
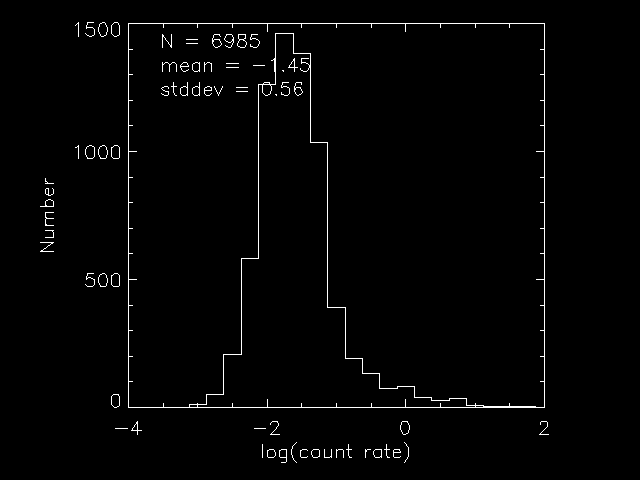
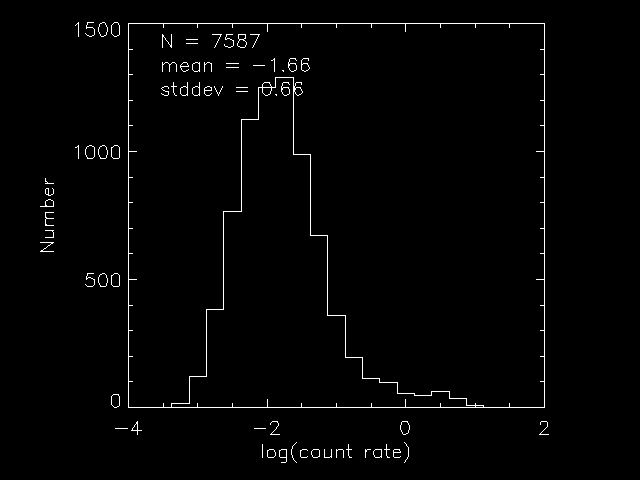
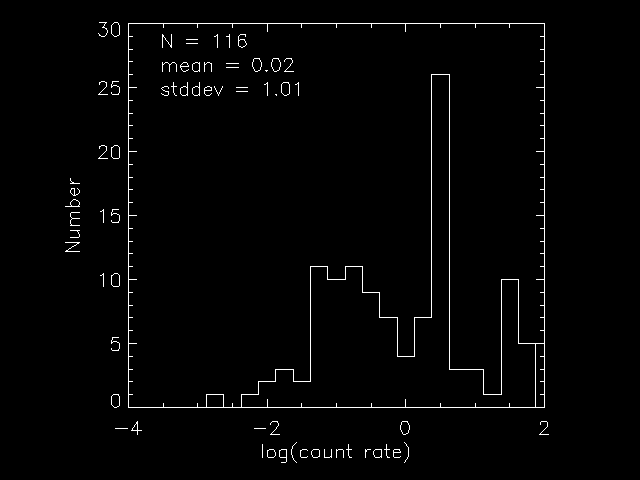
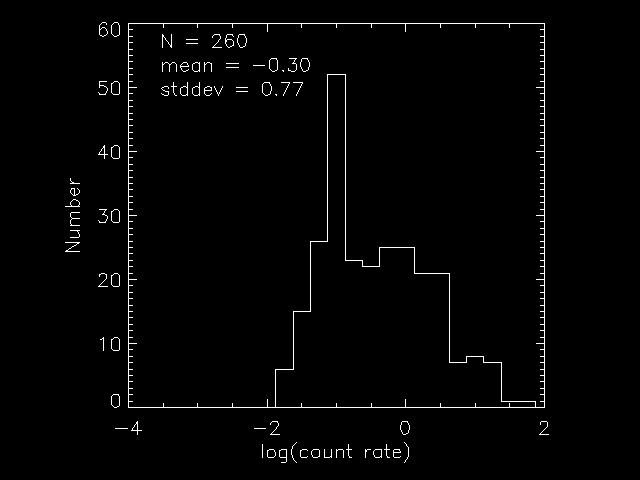
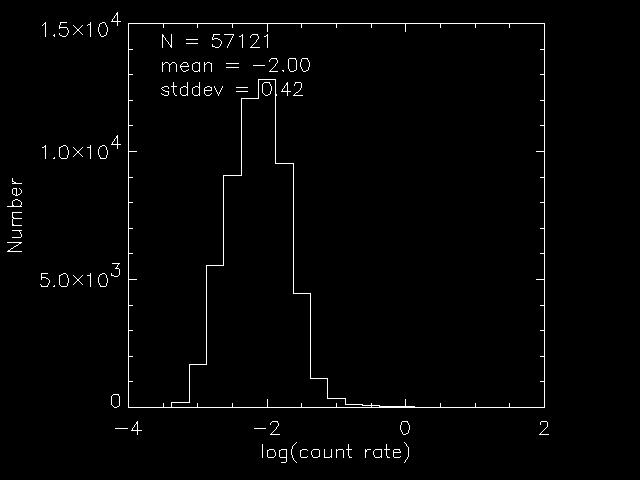
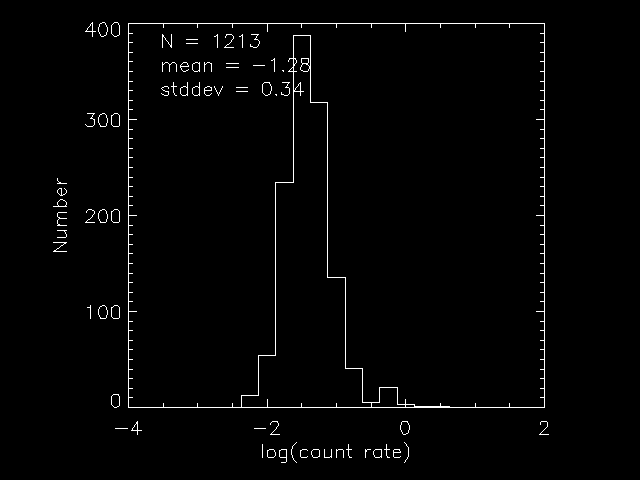
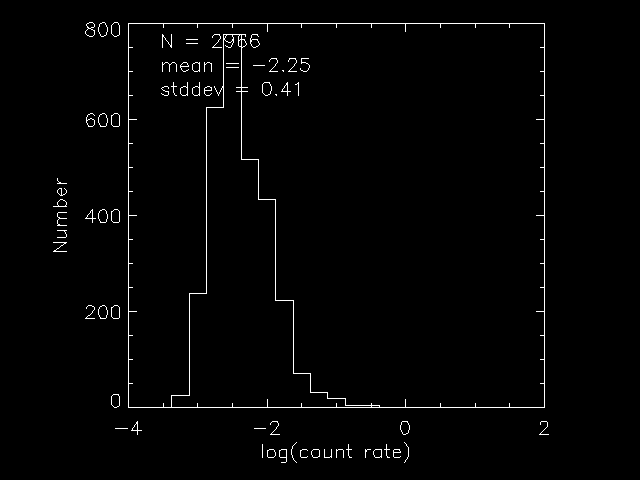
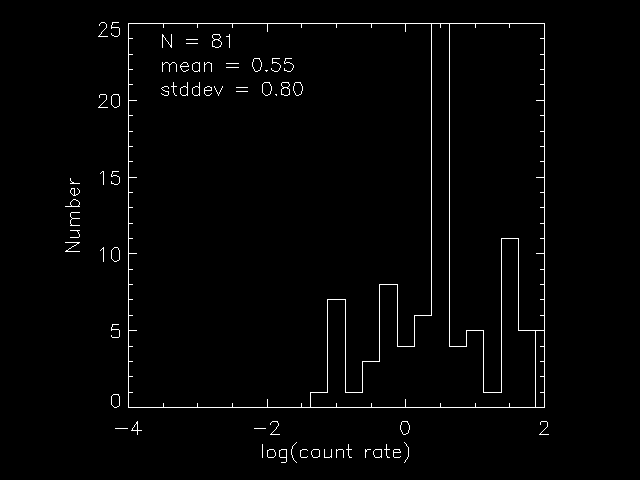
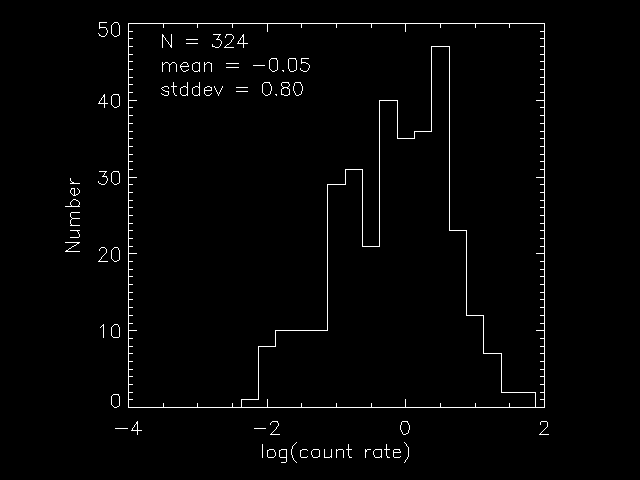
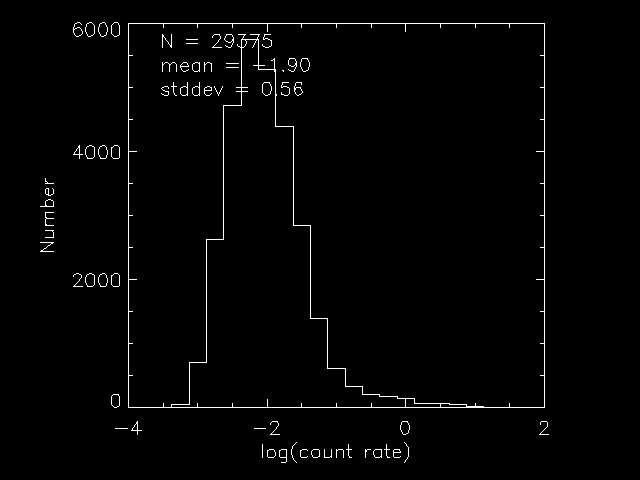
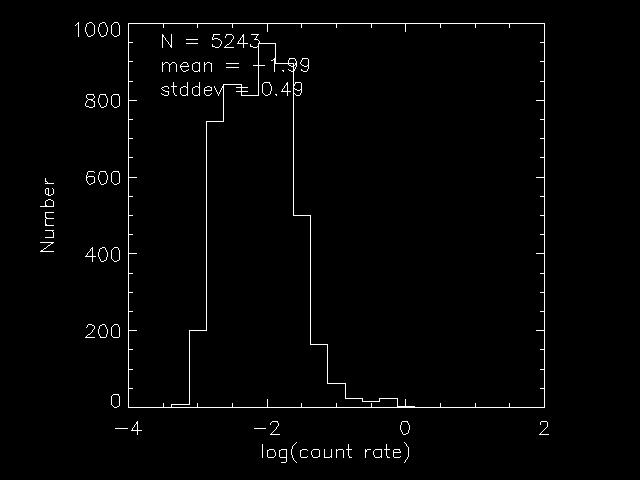
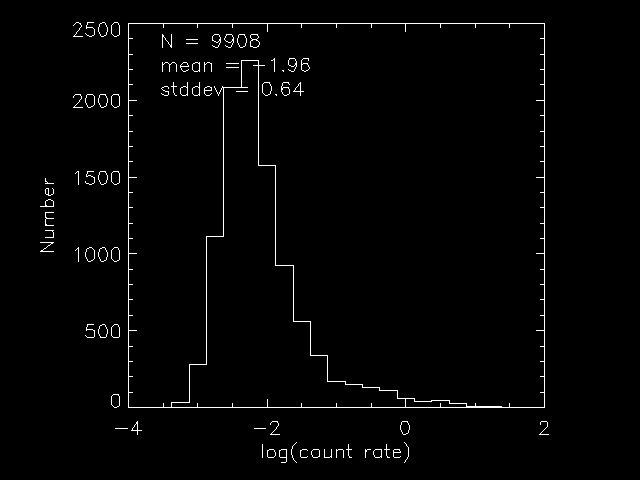
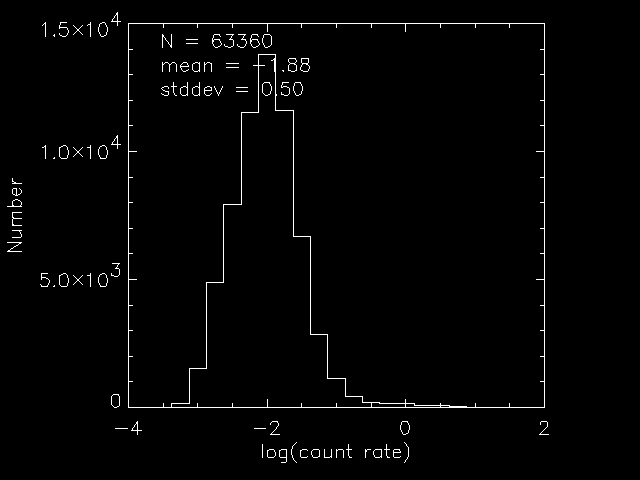
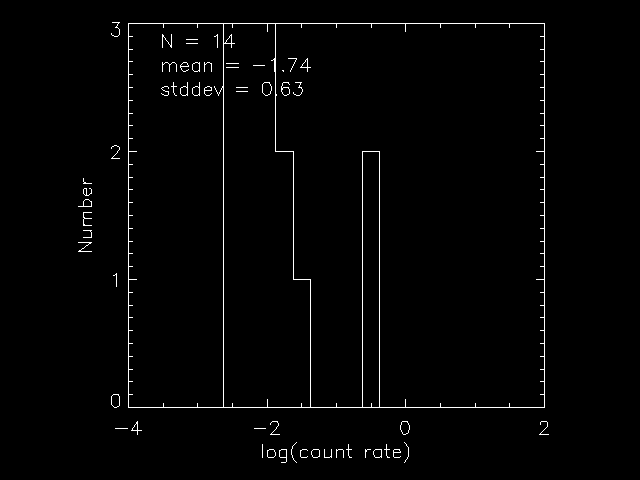
The following table links to sets of histograms showing the logarithmic count rate distributions for the original classes for each training sample.
| Catalog | Distributions |
|---|---|
| RASSBSC |
Star WDwarf XRB+CV Galaxy AGN Cluster |
| RASSFSC | Not available |
| WGACAT |
Star WDwarf XRB+CV Galaxy AGN Cluster |
The following table links to sets of histograms showing the logarithmic count rate distributions for the computed classes for each catalog and classifier.
| Classifier | ||||
|---|---|---|---|---|
| Catalog | RASS-X | RASS-XOR | WGACAT-X | WGACAT-XOR |
| RASSBSC |
AGN Star WDwarf XRB+CV Galaxy Cluster |
AGN Star WDwarf XRB+CV Galaxy Cluster |
AGN Star WDwarf XRB+CV Galaxy Cluster |
AGN Star WDwarf XRB+CV Galaxy Cluster |
| RASSFSC |
AGN Star WDwarf XRB+CV Galaxy Cluster |
AGN Star WDwarf XRB+CV Galaxy Cluster |
AGN Star WDwarf XRB+CV Galaxy Cluster |
AGN Star WDwarf XRB+CV Galaxy Cluster |
| WGACAT |
AGN Star WDwarf XRB+CV Galaxy Cluster |
AGN Star WDwarf XRB+CV Galaxy Cluster |
AGN Star WDwarf XRB+CV Galaxy Cluster |
AGN Star WDwarf XRB+CV Galaxy Cluster |
The following table links to cross-classification tables and class distributions for the computed classes for each catalog and classifier, split into brigher-than and fainter-than the mean logarithmic count rates for each catalog.
Date of last modification: Thursday 19 February 2004
Responsible NASA official: Tom McGlynn
Curator: Eric Winter