

THE XMM-NEWTON ABC GUIDE, STREAMLINED
Analysis of PN-TIMING Data with Xronos (Locally Installed)
We will do some analysis of PN TIMING data of the high mass X-ray binary GX 301-2 (Obs ID 0555200301) with Xronos, which is a powerful timing analysis software package available through the HEASARC. We will assume that the data has been reprocessed with SAS, as shown elsewhere, and a light curve with time bin size of 1 second was made with SAS and named pn_ltcrv.com. Xronos does not have a GUI, so all tasks will be called from the command line. In the examples below, all the tasks prompt the user for further information. Input that we've been prompted for is shown with the indented lines.
Let's start by pulling up a new window and invoking ftools:
ftools
Making a Power Spectrum
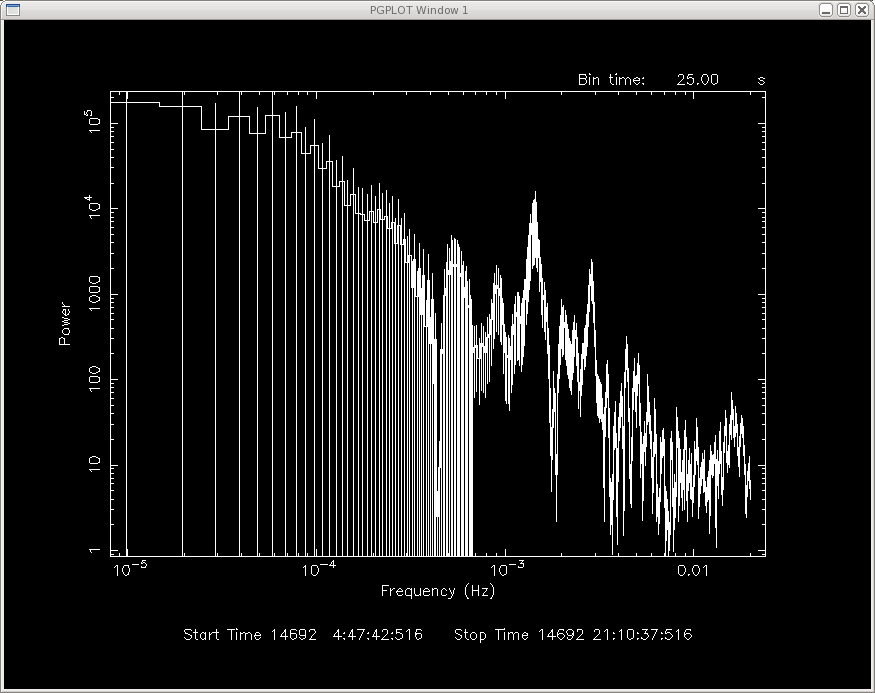
The task powspec calculates the power spectrum density for a given time series, plots the result, and writes the results to a FITS file. We can use the recommended defaults as a starting point.
powspec
   pn_ltcrv.fits
   -
   25
   4096
   1
   0
   [enter]
   [enter]
   [enter]
The output is shown in Figure 1. We can zoom in on a region of interest by resetting the axis minimum and maximum. To quit the plotting software, just type 'exit'.
   r x 0 3e-3
   exit


|
We can also do this with geometric rebinning:
powspec
      pn_ltcrv.fits
   -
   25
   4096
   1
   -1.01
   [enter]
   [enter]
   [enter]
   exit
The output is shown in Figure 2.
Finding the Period of a Source
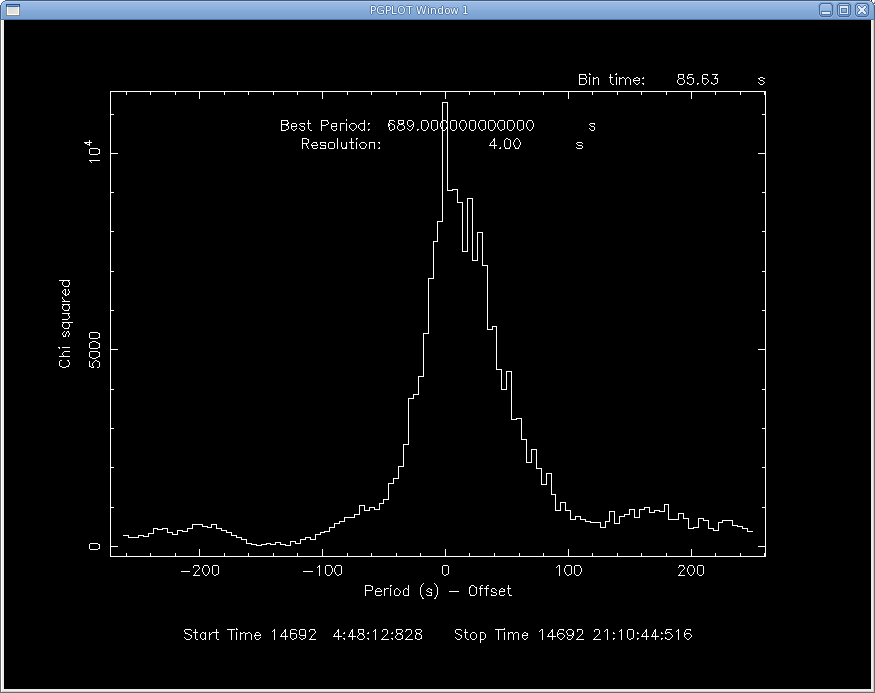
We can also search for the source's period with the task efsearch. The period was determined by Furst et al. (2011) to be 685 s, so we will use that as a starting point.
efsearch
   pn_ltcrv.fits
   -
   INDEF
   685
   8
   689
   4
   128
   [enter]
   [enter]
   [enter]
   exit
The output is shown in Figure 3. efsearch automatically indicates the best period and resolution at the top of the plot, with the bin size on the upper right side.
|
Making a Folded Light Curve
The task efold will produce a folded light curve.
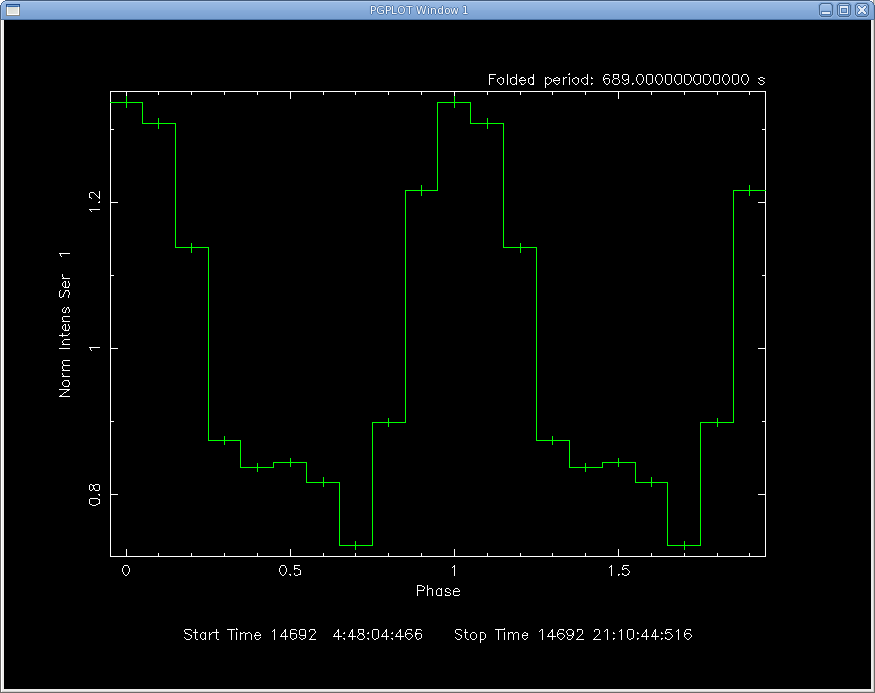
efold
   1
   pn_ltcrv.fits
   -
   INDEF
   689
   10
   857
   1
   [enter]
   [enter]
   [enter]
We can add a line to the plot to make it easier to see.
   line step
   p
And color, if we are feeling fancy. In the statement below, "3" refers to the color choice and "2" refers to the data on the Y axis. If we wanted to turn off the error bars, we could also enter the command error off.
   color 3 on 2
   p
   exit
The plot is shown in Figure 4. By default, the folded period is shown in the upper right part of the plot.
If you have any questions concerning XMM-Newton send e-mail to xmmhelp@lists.nasa.gov