(added in 2004: In early 1998 it was briefly thought that a 12 hour period had been detected
in PCA observations of the AGN IRAS18325. This page is a summary of K. Jahoda's investigations
into the reality of that period.)
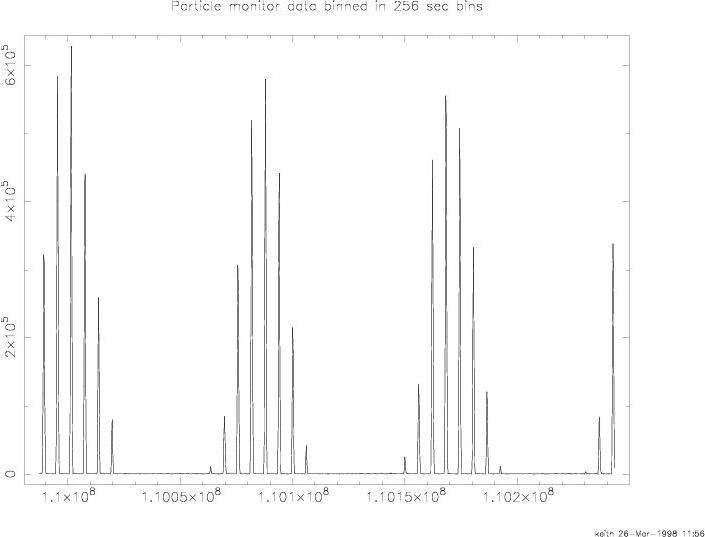
Here is a light curve from the Hexte particle monitor. The rates
have been integrated for 256 seconds. The x-axis is in
seconds and the y axis is total counts per 256 sec bin.
(The y axis may have a factor of 4 scale problem, but if so, it applies
to all values.)
and a fourier transform of this data

The rate plot clearly shows the SAA orbits and a daily modulation;
the fourier transform plot clearly shows the daily period, with a
peak near 1e-5 Hz, and the orbital period, with a cluster of peaks
near 1.7e-4 Hz. Harmonics are also present. The harmonic of the daily term
probably arises due to the non-sinusoidal nature of the daily
modulation. It is worrisome as this harmonic comes at 2.5e-5 Hz.
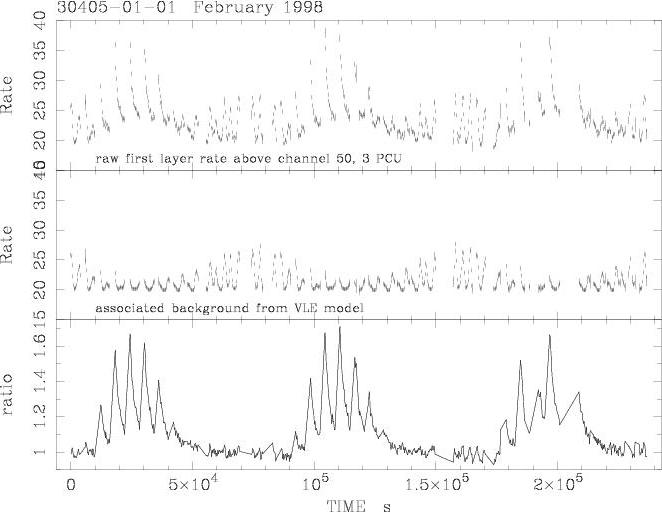
Now, look at the February data. First I take all the data, with
no .gti file selection. This is equivalent to assuming that the
non-slew obs-ids contain only source data. This is approximately
true, but I filtered out ~10 bins by hand (because slews had
started).
The figure shows 3 rates. The upper symbols
represent data, integrated over 3 PCU, channels 10-27. There are 613
points, each representing 256 seconds, or nearly 157 ksec total.
The middle points represent a "scaled VLE background". This is
constructed by taking the ratio of data, channels 50-249, to
the VLE background in the same channels, and multiplying the VLE
background in channels 10-27 by this number. The
ratio is shown in a separate figure.
The third panel of the rates figure is
the raw counting rate minus this background model.
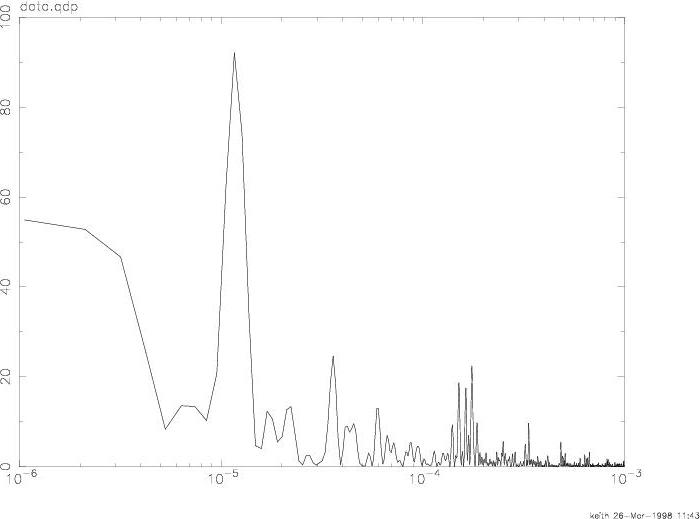
I have done a fourier transform of each of the three rates, shown
below:
Transform of the data
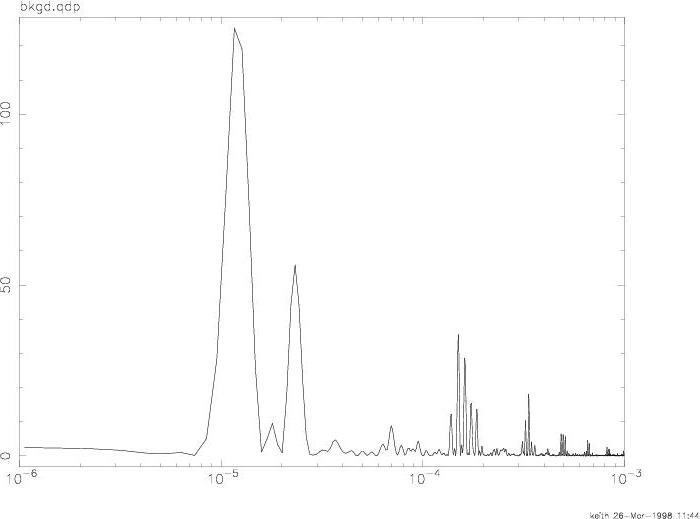
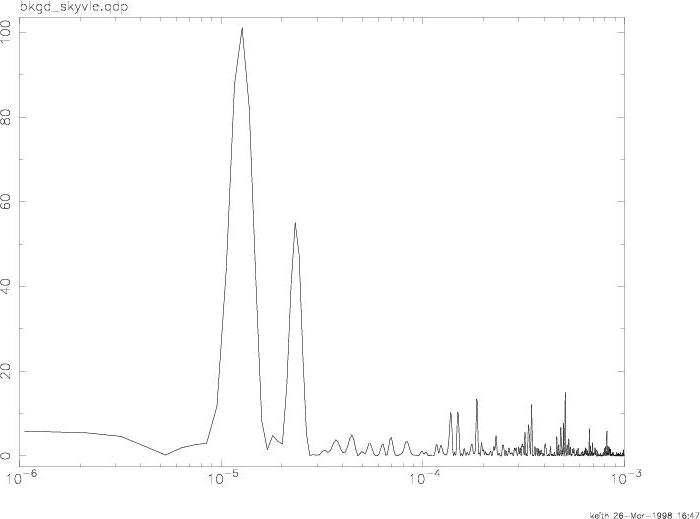
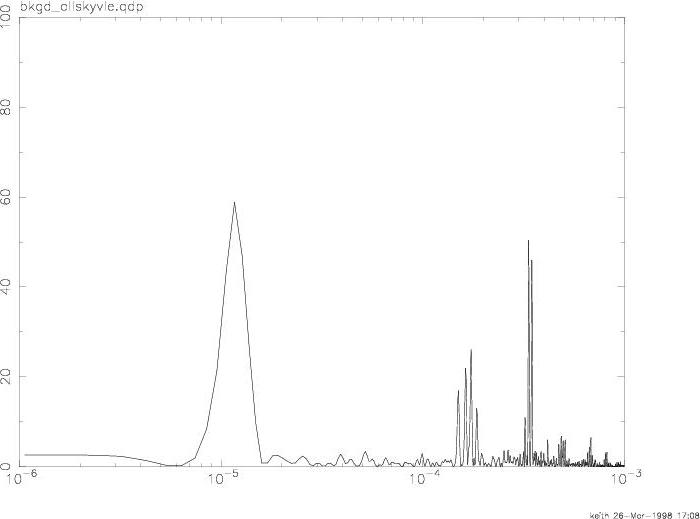
Transform of the sclaed VLE background model
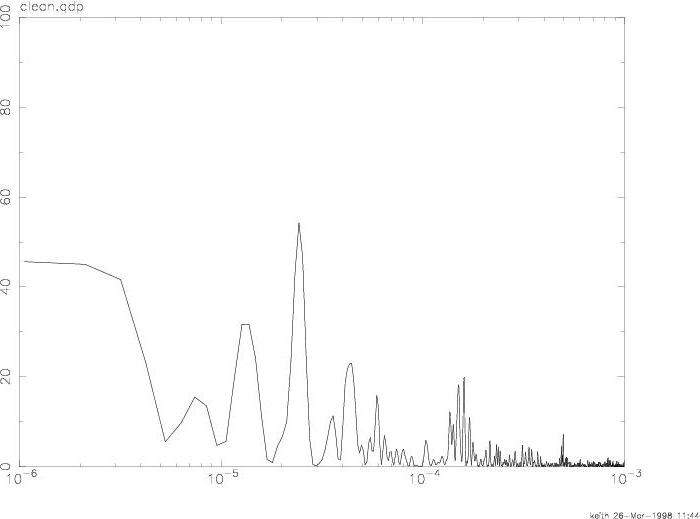
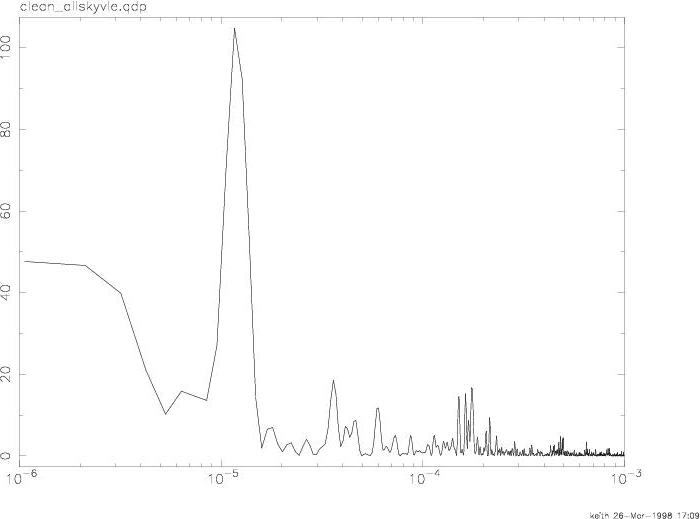
Transform of the "clean" data
The data is notable for having NO power at 2.5e-5 Hz, though it
does show the daily and orbital periods clearly. The model background
shows both of these periods, and a harmonic of the daily period(?)
which shows up right at 2.5e-5 Hz. The "clean" data, not surprisingly
shows a signal at 2.5e-5 Hz. One instant conclusion is that the scaled
VLE background model (which was necessary to use all the data) is
not very good.
What if we use only part of the data, and a model consisting of a VLE component
and an activation component?
Using background models
pca_bkgd_skyactiv_e03v01.mdl
pca_bkgd_skyvle_e03v02.mdl
and a condition that housekeeping exists and "NUM_PCU_ON .ge. 3" gives 471
intervals of 256 seconds, or 121 ksec. These background models are, I believe,
the ones that Julia used (available from the PCABACKEST page).
The 3 transforms look like this:
Transform of the data
Transform of the VLE plus active model
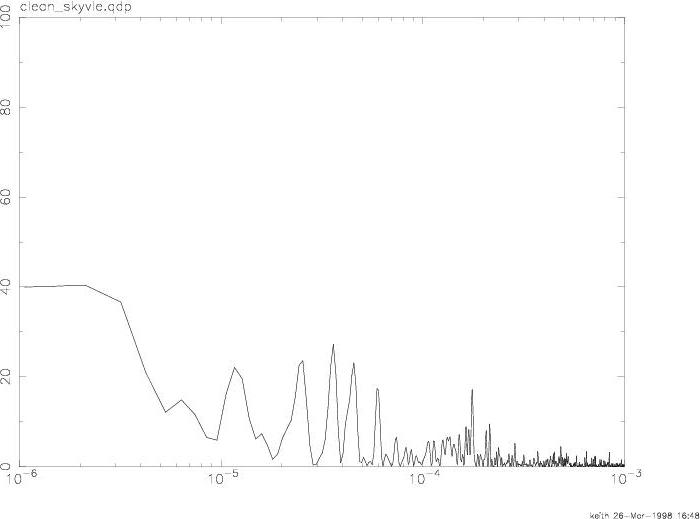
Transform of the "clean" data
Using background models
pca_bkgd_allskyactiv_e03v01.mdl
pca_bkgd_skyvle_e03v02.mdl
and a condition that housekeeping exists and "NUM_PCU_ON .ge. 3" gives 471
intervals of 256 seconds, or 121 ksec. These are slightly improved, as described
below. The 3 transforms look like this:
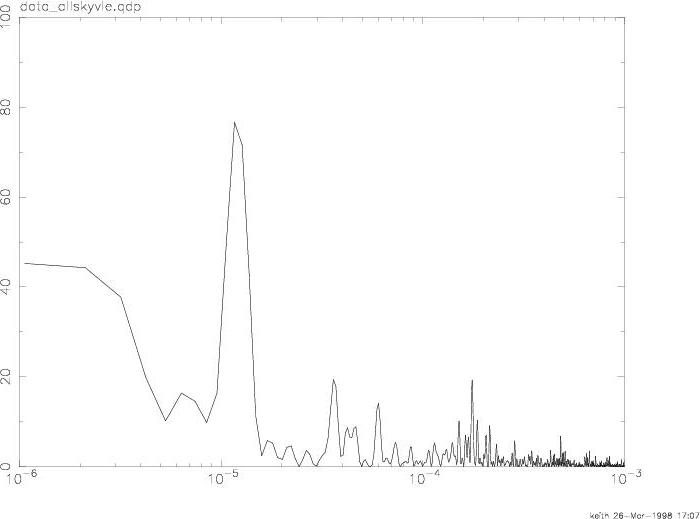
Transform of the data
Transform of the VLE plus all sky active model
Transform of the "clean" data
The models that Julia used were constructed as follows. The "SAA free" half of
the data were used to construct a VLE model. This model was subtracted from the
SAA data, and an activation component was fit to the SAA data which cover about half
the orbit. This component comes close to 0 at the edge of the boundary, but is not
zero. This introduces a small step, which has in fact shown up as an ~half day
periodicity.
The newer models started with the same VLE model, which was then removed from the
entire sky, and an activation model was fit to the whole sky. This, at least,
removes the small step at the boundary between SAA orbits and non SAA orbits (which
was an artificial distinction anyway). The associated transform of the backgound model
is cleaner, and the half day power is not transferred into the signal. Of course,
these modles did a terrible job of removing the daily component, so we aren't there
yet. These models are still experimental,
(added in 2004: Models produced after mid 1998 do not include artificial power at 2.5e-5 Hz)
So I am now dubious about the QPO in February AND December. I apologize, sincerely,
particularly as so many people have become interested in the result. My error
was to focus on the gaps in the realtime data, when a gap in the background model
was apparently much more important.
1 April 1998
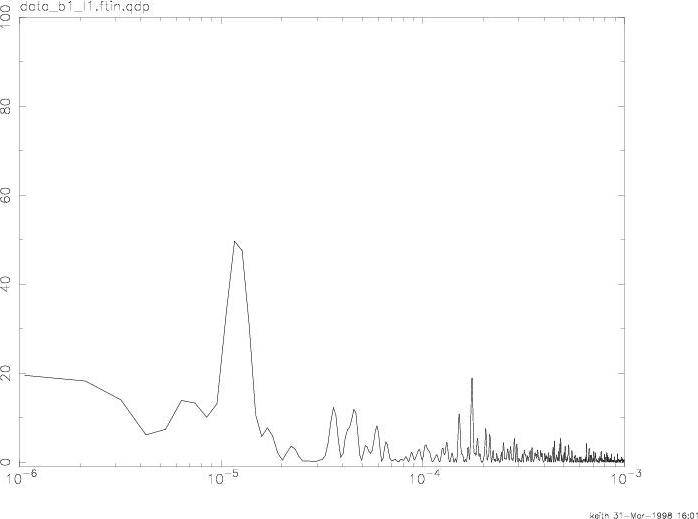
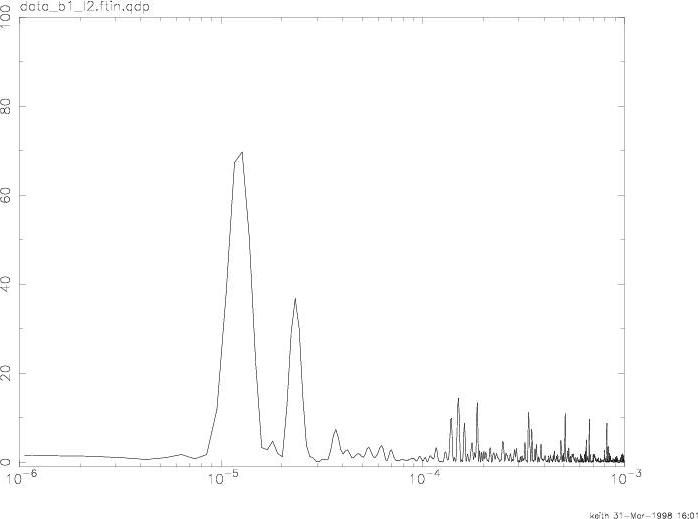
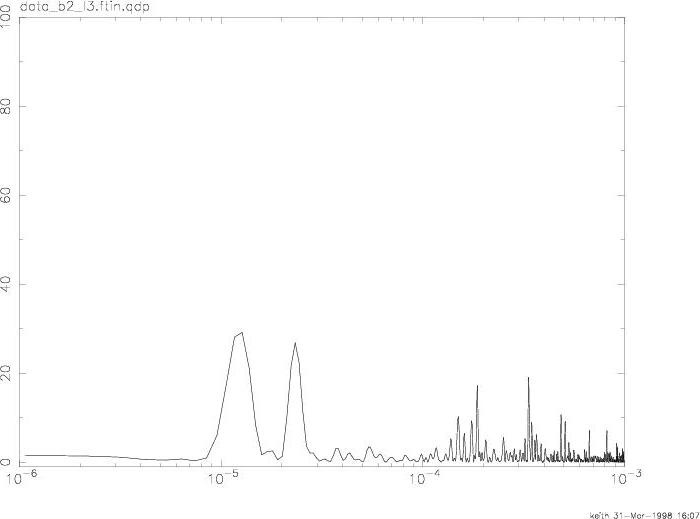
I have made Fourier Transforms of 9 subsets of the February data. All cases use
3 detectors over the whole observation. No background has been removed.
The 9 cases correspond to all combinations of 3 channel ranges (10-27, 28-50,
and 51-249 labelled b1,b2,b3 respectively) and 3 layers (l1, l2, l3). The
first layer and the low channels are where signal from the source is expected.
The other combinations should have a much reduced source signal and comparable
background. The transforms of these light curves all show power at day scales
(1e-5 Hz ) and orbit scales (2e-4 Hz). Many of the transforms (not including
layer1, band1) show power at 2.5e-5 Hz. The "signal" transform (band1, layer1)
does show the largest power at 3.5e-5 and 4.5e-5 Hz (8 and 6 hours). While
intriguing, this needs more study (ongoing).
Transform of layer 1, channels 10-27 and
FITS format lightcurve
Transform of layer 1, channels 28-50 and
FITS format lightcurve
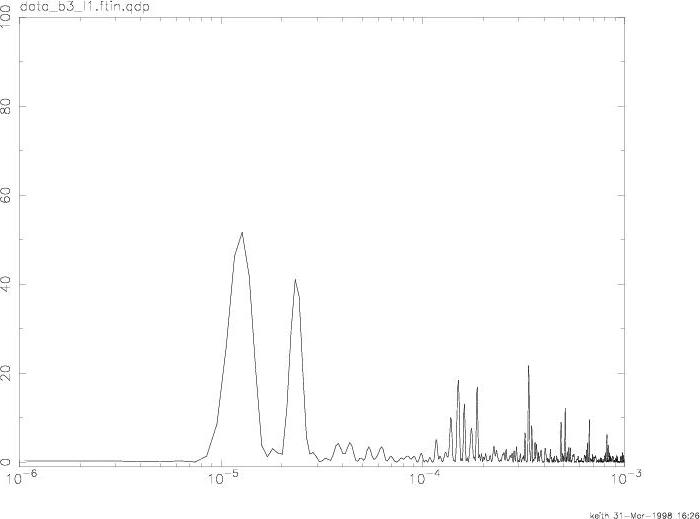
Transform of layer 1, channels 51-249 and
FITS format lightcurve
Transform of layer 2, channels 10-27 and
FITS format lightcurve
Transform of layer 2, channels 28-50 and
FITS format lightcurve
Transform of layer 2, channels 51-249 and
FITS format lightcurve
Transform of layer 3, channels 10-27 and
FITS format lightcurve
Transform of layer 3, channels 28-50 and
FITS format lightcurve
Transform of layer 3, channels 51-249 and
FITS format lightcurve