March 30, 2000
This note documents an investigation into the nature of the data
that cannot be fitted by the current background model. Specifically,
there are large excursions in the count rate observed during the one
day background observation on 97/01/01. Light curves were extracted
from the data using the standard selection criteria for faint sources
(Table 1). The observed rate (sky plus internal
background), model predicted rate, and observed-model rate are shown
for 5 PCU, front layer, and channels 0-27 (Figure
1). Large flares are present in these data, and are clearly not
accounted for in the background model. It has been verified that these
large flaring events are present in the individual PCU, and are seen
at a lower level in the middle layer.
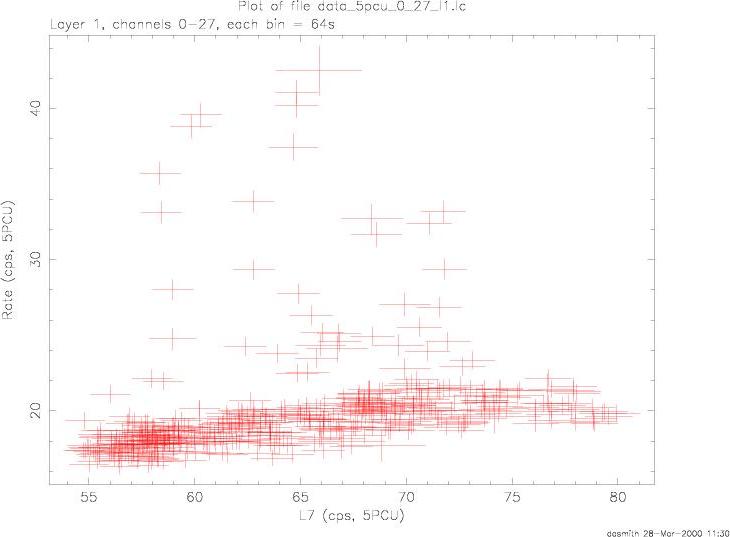
The L7 rate should scale linearly with the observed background
rate. However, it is clear that in these data, the linear relationship
breaks down during the large flaring events (Figure
2). The data could be "cleaned" by fitting the L7/observed count
rate linear relationship, and deleting data points which lie N
standard deviations from the best-fit (where N is a user
defined quantity). However, for variable sources, the L7 rate does
not scale linearly with the observed count rate, and the data cannot
be cleaned using this method.
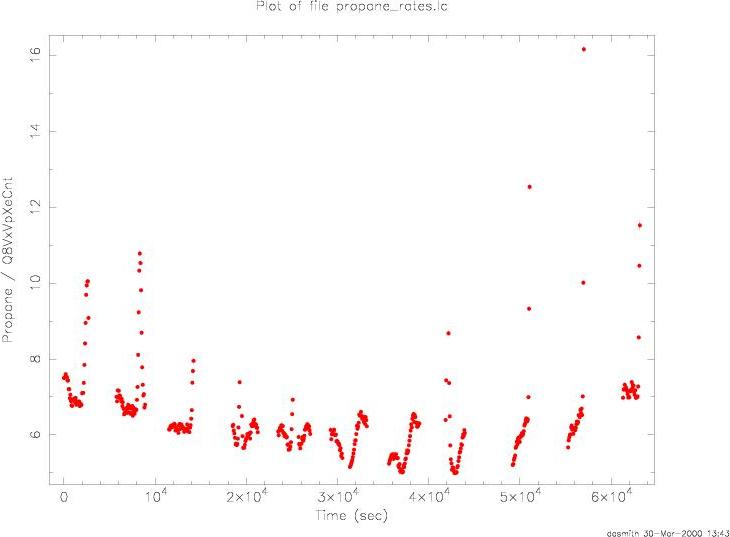
Similar flaring events are seen in the propane layer (VpSpecPcuN;
N=0...5). The propane rates for the individual detectors were co-added
and the resultant rate was normalized to the background rate as
measured by the Q8VxVpXeCnt rate (Figure 3).
Although the propane/Q8VxVpXeCnt count rate ratio increases rapidly
during the large flaring events, the ratio also increases during
periods of quiescence background. Thus, the ratio does not provide a
good predictor of erratic background; similar ratios were obtained
using different HK rates as the denominator.
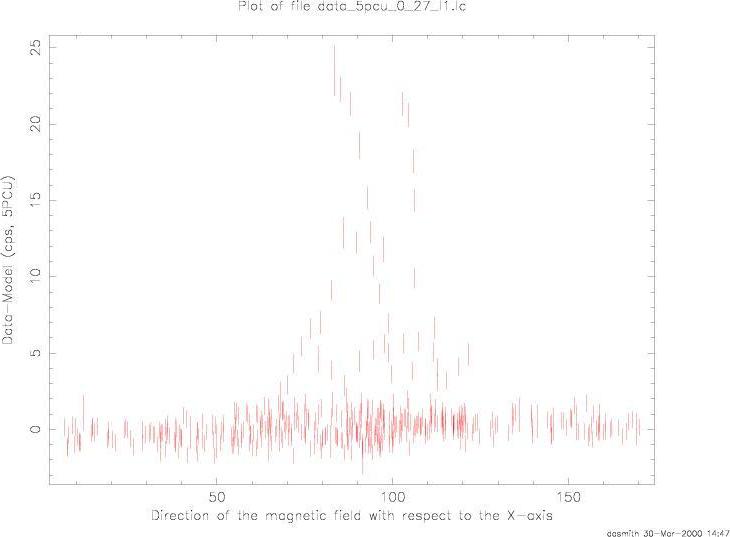
Finally, we consider the possibility that the rapid increase in
the background is caused by the geomagnetically trapped particles with
moderate energy. The observed-model rate is shown as a function of the
angle btween the satellite pointing direction and the geomagnetic
field line (Figure 4). Although there is an
increase in the residual rate close to 90 degrees, in agreement with
that found for the Ginga satellite, there is a large dispersion in the
data.
We conclude that the outliers occur durin periods when the
L7/background rate linear relationship breaks down. However, it is not
clear what the nature of this breakdown is, or whether periods of
similar breakdowns can be identified in source data.
Table 1: Selection Criteria
| Criterion |
Description |
| (BKGD_THETAa < -70.0
or BKGD_THETA > 150.0) or TIME_SINCE_SAAb > 30.0
or TIME_SINCE_SAA < 0.0 |
Outside the South Atlantic Anomaly |
PCUn_ON  0.5 0.5 |
PCUn fully on |
| ELV > 10.0 |
Angle between the satellite pointing direction and the
Earth's horizon |
| OFFSET < 0.01 |
Angle between the satellite pointing direction and the
nominal field of view |
| VpX1L, VpX1R < 6.25 |
Veto rate between the propane layer and the left/right
halves of the Xenon layer |
| (VpX1L+VpX1R)/Q6c < 0.1 |
Normalized propane layer veto rate |
a Longitude of the ascending node of the satellite's orbit
b Time since SAA passage
c Veto rate between six of the eight anode chains