Table 1: Pointing Directions
| Pointing | ||
| 1a,b | 5.00 | -67.00 |
| 2a | 60.00 | +2.00 |
| 3a | 138.00 | +15.00 |
| 4a | 235.00 | +10.00 |
| 5a | 345.00 | -18.00 |
This note documents the current estimate of the systematic error in the Epoch 3 faint source (L7_240) model background for different energy bands. Below 10 keV, the systematic error is approximately 0.15 cts/s/3pcu, or 2% of the background count rate, and is three times as large as the statistical error on a given data point. Above 10 keV, the systematic error is at least 0.1 cts/s/3pcu, or 0.5% of the background rate, and is twice as large as the statistical error.
The background data are accumulated from five different pointing directions (table 1). Data from three out of every four obsids were used in the construction of the model. Below 10 keV, where the statistical uncertainty in each data point is much smaller than the systematic error, light curves were extracted from the data that did not go into the construction of the model. However, above 10 keV, the systematic error is comparable to the statistical error, even when the data are binned coarsely. Therefore, to improve the signal to noise, light curves were extracted from all the data above 10 keV. From an extrapolation of the HEAO-1 results, spatial fluctuations in the Cosmic X-ray Background (CXB) are expected to contribute approximately ±0.4 cts/s/3pcu in the 2-10 keV band. Therefore, below 10 keV, the spatial fluctuation in each pointing direction has been subtracted prior to estimating the systematic error (errors estimates without subtracting the spatial fluctuation are also given; they should be regarded as a strong upper limit). The standard selection criteria for faint sources was used in the extraction of the light curves (table 2).
| Pointing | ||
| 1a,b | 5.00 | -67.00 |
| 2a | 60.00 | +2.00 |
| 3a | 138.00 | +15.00 |
| 4a | 235.00 | +10.00 |
| 5a | 345.00 | -18.00 |
| Criterion | Description |
| (BKGD_THETAa < -70.0 or BKGD_THETA > 150.0) or TIME_SINCE_SAAb > 30.0 or TIME_SINCE_SAA < 0.0 | Outside the South Atlantic Anomaly |
| PCUn_ON |
PCUn fully on |
| ELV > 10.0 | Angle between the satellite pointing direction and the Earth's horizon |
| OFFSET < 0.01 | Angle between the satellite pointing direction and the nominal field of view |
| VpX1L, VpX1R < 6.25 | Veto rate between the propane layer and the left/right halves of the Xenon layer |
| (VpX1L+VpX1R)/Q6c < 0.1 | Normalized propane layer veto rate |
Light curves are made available showing the observed-model rate ,
Xi , for the different energy bands (column 2
in table 3). The statistical error for
individual points is simply the Poisson error, ![]() i =
i =
![]() R
i , where Ri is the observed
rate (sky plus internal background). For a particular light curve, the
total variance is given by
R
i , where Ri is the observed
rate (sky plus internal background). For a particular light curve, the
total variance is given by
 |
where the individual data values are weighted by a factor
 |
which includes both systematic and measurement errors. The latter is given by
 |
and the derived systematic error is
 |
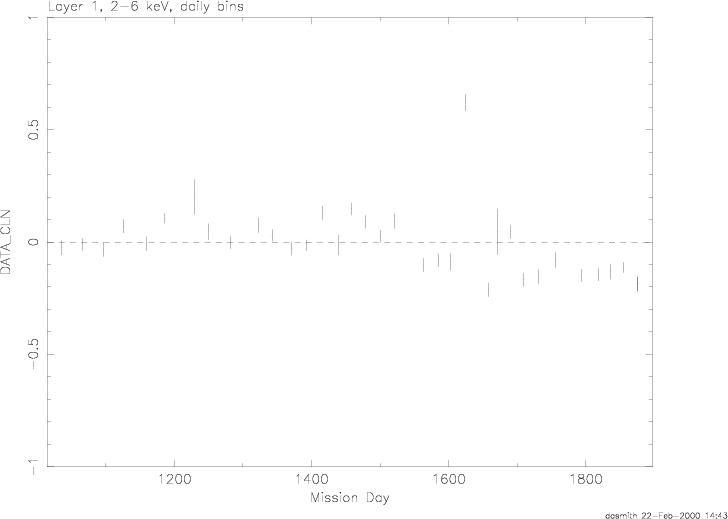
The standard deviation, average error, and derived systematic error are given for each energy band (table 3), with the values of systematic error quoted as cts/s, cts/s/ch, and as a percentage of the observed rate (sky plus internal background).
| Energy Band | Residuals vs Time |
su | < err > | counts/s |
counts/s/chan |
% bkgd rate |
2-6 keVa |
2-6.jpg | 0.137 | 0.030 | 0.134 | 0.011 | 2% |
2-6 keV |
2-6.jpg | 0.217 | 0.030 | 0.215 | 0.018 | 3% |
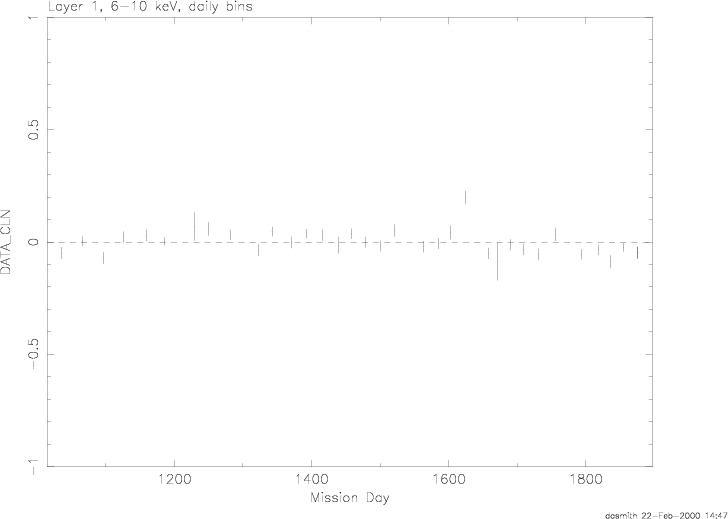
6-10 keVa |
6-10.jpg | 0.048 | 0.025 | 0.042 | 3.8E-3 | 1% |
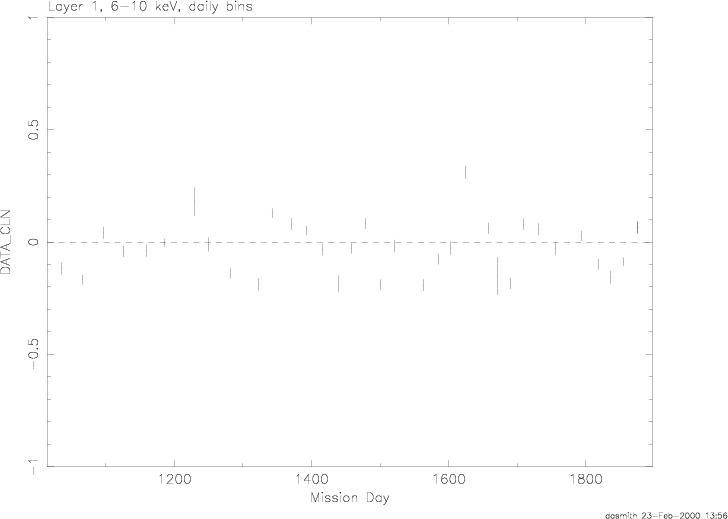
6-10 keV |
6-10.jpg | 0.110 | 0.025 | 0.107 | 9.7E-3 | 2.2% |
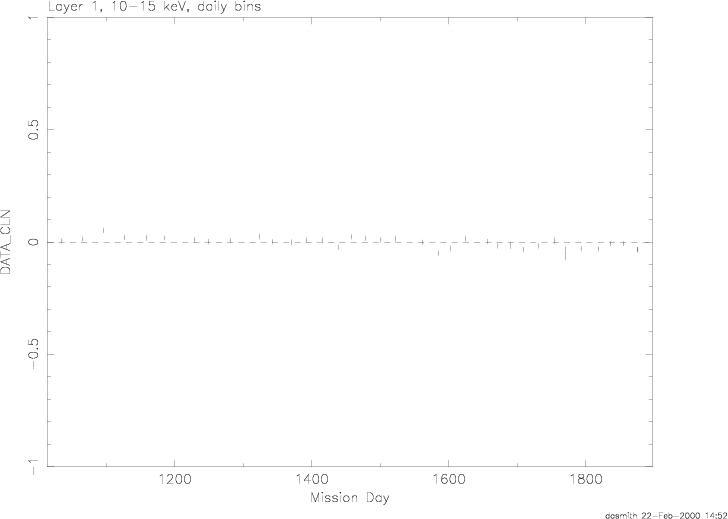
10-15 keV |
10-15.jpg | 0.023 | 0.011 | 0.021 | 1.5E-3 | 0.6% |
15-20 keV |
15-20.jpg | 0.017 | 0.010 | 0.013 | 1.0E-3 | 0.5% |
20-30 keV |
20-30.jpg | 0.048 | 0.013 | 0.046 | 3.5E-3 | 0.8% |
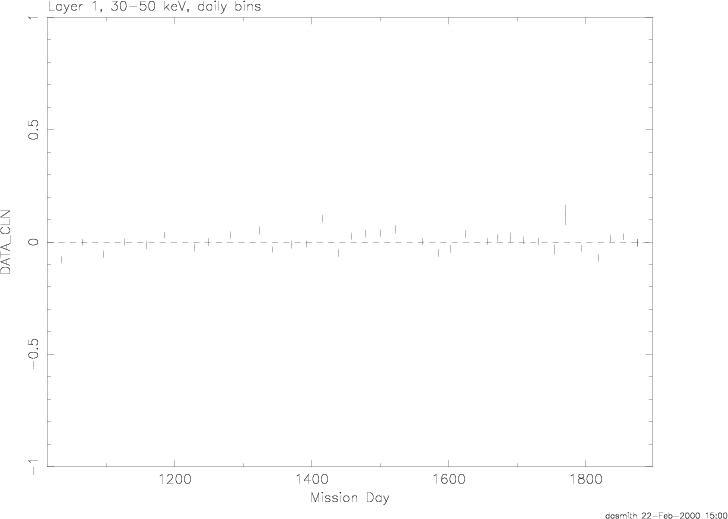
30-50 keV |
30-50.jpg | 0.042 | 0.015 | 0.039 | 1.5E-3 | 0.5% |