(This note origianlly prepared 1998-11-16)
This note sumamrizes the demonstrated performance of the energy scale
as estimated by the matrices of pcarmf v3.5 (ftools v4.2 and ftools
v4.1 if the
erratum is taken into account.
The energy scale is determined from several continuously present
and tagged lines from the Americium 241 source. (Each user may monitor these
lines; the tagged photons are telemetered as part of the Standard 1
data). The measured lines include Np L lines at 13.93, 17.53, and
21.13 keV, Np nuclear lines associated with the decay (via alpha emission)
of the Am nucleus at 26.35 and 59.54 keV, and a line near 30 keV which is
the blend of the Xenon K-alpha line and the 59.54 keV line after
a K-alpha escape.
While well determined, these lines are all at relatively high energies
compared to the energy range where the PCA efficiciency peaks.
We also have occasional measurements of of the supernova remnant
Cas A, and therefore can measure an unconfused and bright Fe line. We
assume that the energy of the Fe line is 6.59 keV, which matches the
Ginga measurement and is about the average of several independent pointings
with the ASCA GIS (all of which are included within the PCA field of view).
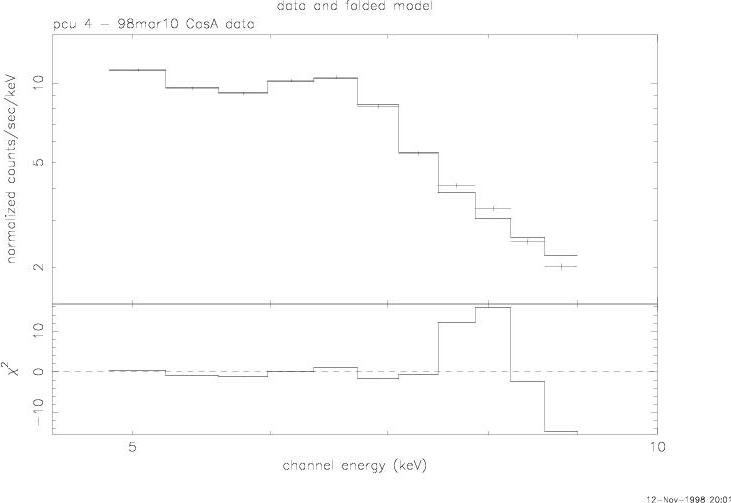
Figure 1 shows a typical fit from 4.5-9.0 keV.
The model consists of a steep powerlaw (photon index ~-3) and a narrow
gaussian. Residuals near 8 keV indicate that a detailed model would need
to account for Fe K-beta emission as well.
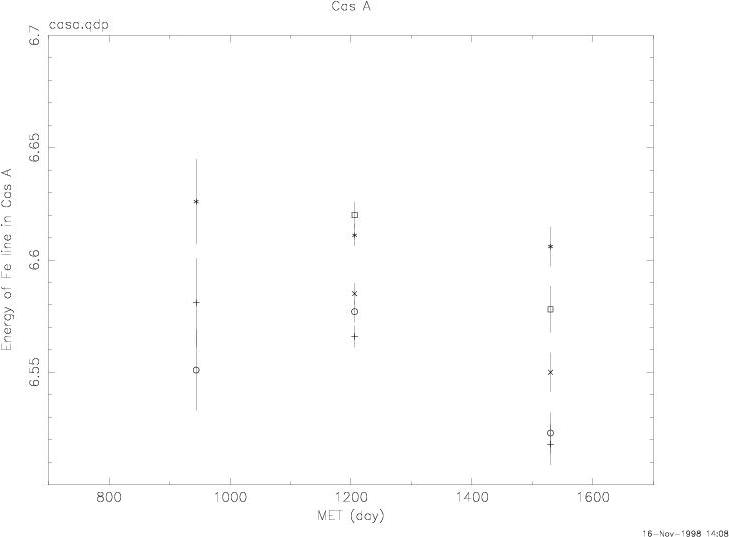
Figure 2 shows the energies fit for each detector
during observations in August 96, April 97, and March 98. Note that during the
first set of observations 2 of the detectors (PCU 3 and 4) were off and
only 3 points are plotted. In general, the fitted energy matches the
expectation well for all detectors.
We do not have any astrophysical line sources available for measuring the
energy response at lower energies, particularly those below the Xe L edges,
where one might expect difficulty in extrapolations from higher energies.
We can, however, measure the apparent energy of the Xenon absorption edge
as follows. Since there is some Xe present in the propane layer of each detector,
we make a matrix where we artificially set the amount of Xenon in the propane
layer to 0; fits to any source now require the additional presence of an
edge near 4.78 keV. We have applied this approach using data obtained
during monitoring observations of the Crab nebula.
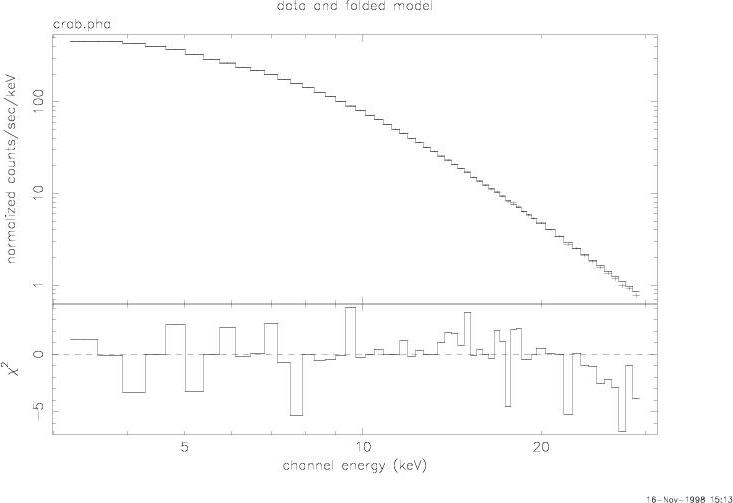 Figure 3 shows the results of fitting
a power-law + edge + absorption model to a typical crab monitoring observation
(PCU 2, 25 December 1996). The edge is fit at 4.93 keV in this case, somewhat
higher than the expected value of 4.78 keV. (Adding additional edges to account for the L-I and L-II edges does not change the fite energy for the dominant
L-III edge. Note also that there is little useful information in the fit values
of the photon index or absorption column as we have deliberately made a
"nonsense" matrix where the fit parameters include information about the
source and detector; only the edge energy can be cleanly separatted to
describe the detector only.) We show for each detector the results of similar
fits to numerous sets of Crab data:
Figure 3 shows the results of fitting
a power-law + edge + absorption model to a typical crab monitoring observation
(PCU 2, 25 December 1996). The edge is fit at 4.93 keV in this case, somewhat
higher than the expected value of 4.78 keV. (Adding additional edges to account for the L-I and L-II edges does not change the fite energy for the dominant
L-III edge. Note also that there is little useful information in the fit values
of the photon index or absorption column as we have deliberately made a
"nonsense" matrix where the fit parameters include information about the
source and detector; only the edge energy can be cleanly separatted to
describe the detector only.) We show for each detector the results of similar
fits to numerous sets of Crab data:
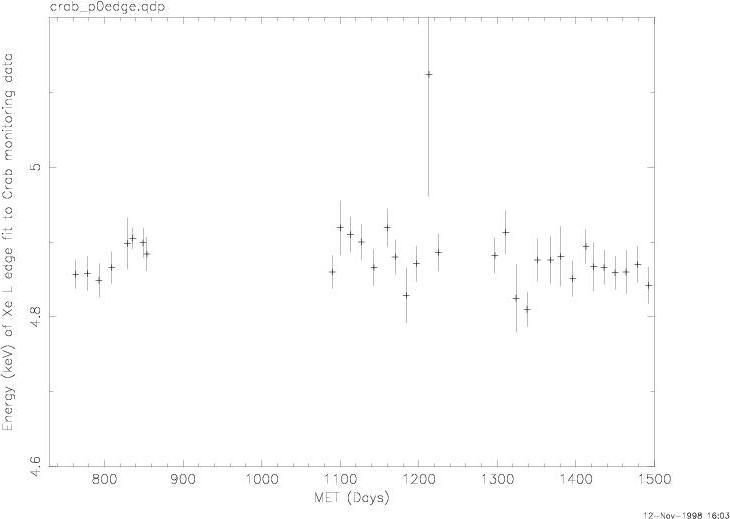
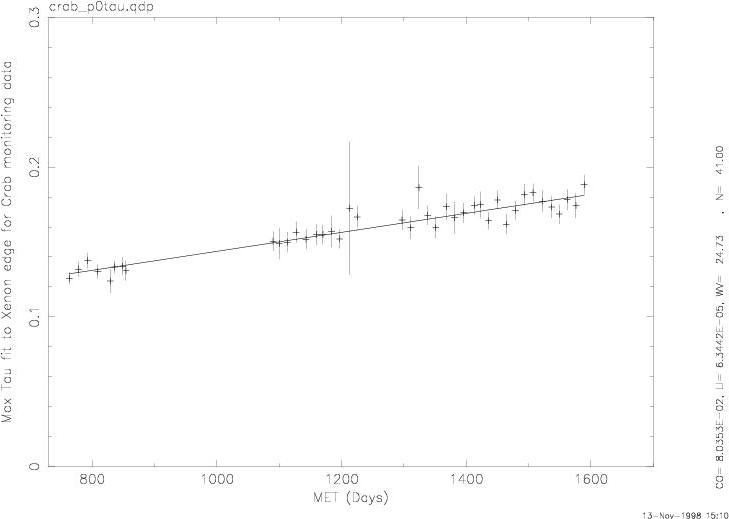
PCU 0 fit energies for Xe edge;
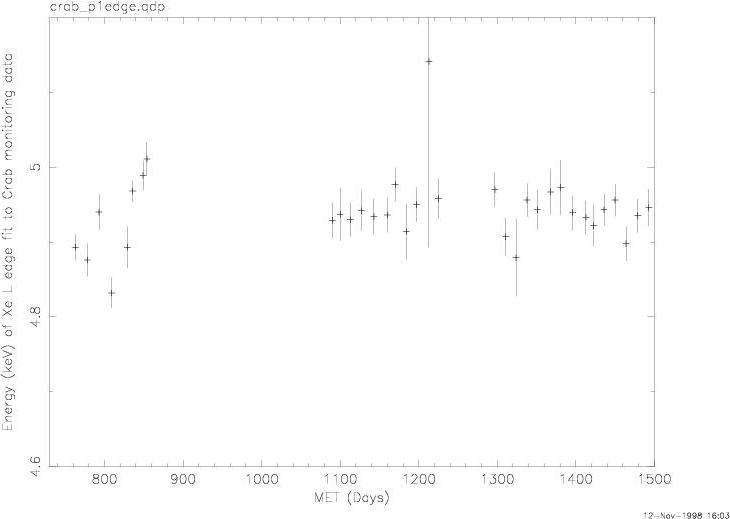
PCU 1 fit energies for Xe edge;
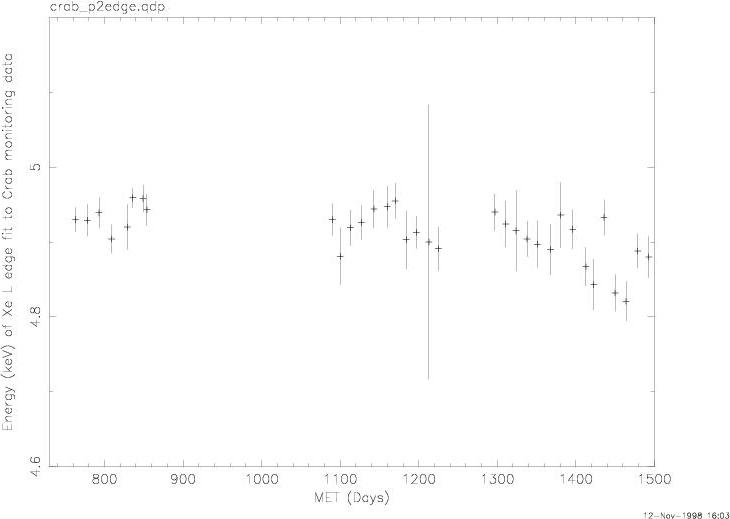
PCU 2 fit energies for Xe edge;
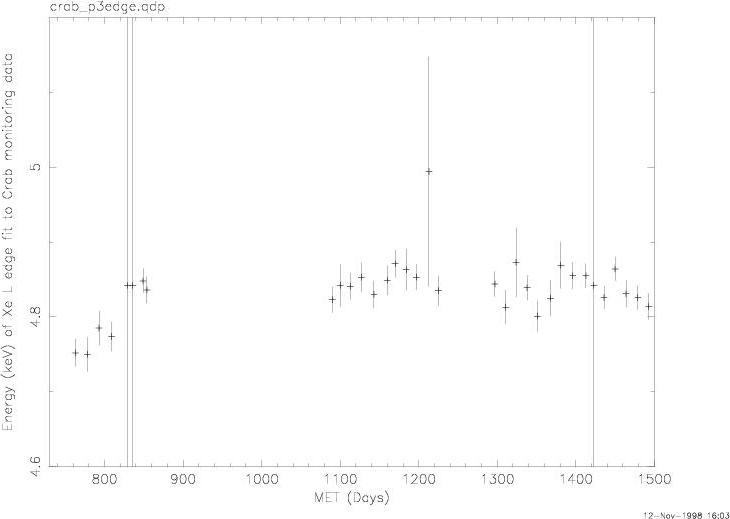
PCU 3 fit energies for Xe edge;
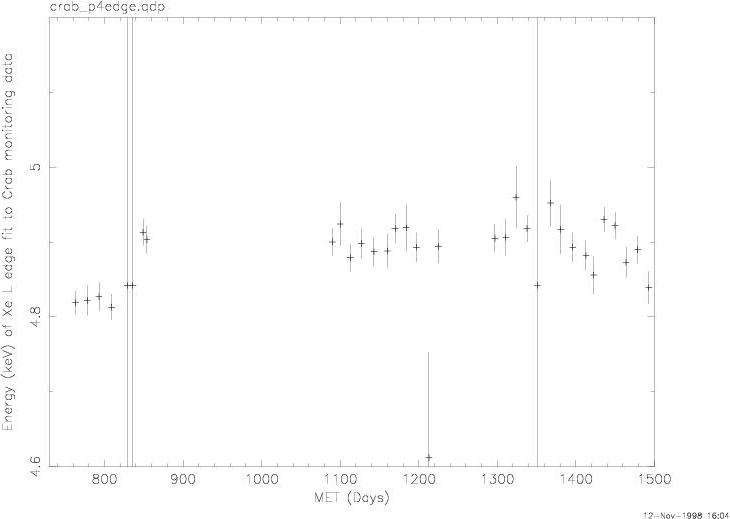
PCU 4 fit energies for Xe edge;
In general, we find that the Xe-L edge is fit about 0.1 keV too high (i.e.
near 4.9 keV). This is an important shortcoming of the current matrices,
but as this is a status report, we defer a discussion of our strategy
for dealing with this to a future report.
As an aside, we note that our model of the PCA detectors includes
a time dependent amount of Xe in each of the propane layers.
The following figures show the optical depth fit to the Xenon
edge as a function of time for each of the fits summarized above.
 PCU 0
PCU 0
;
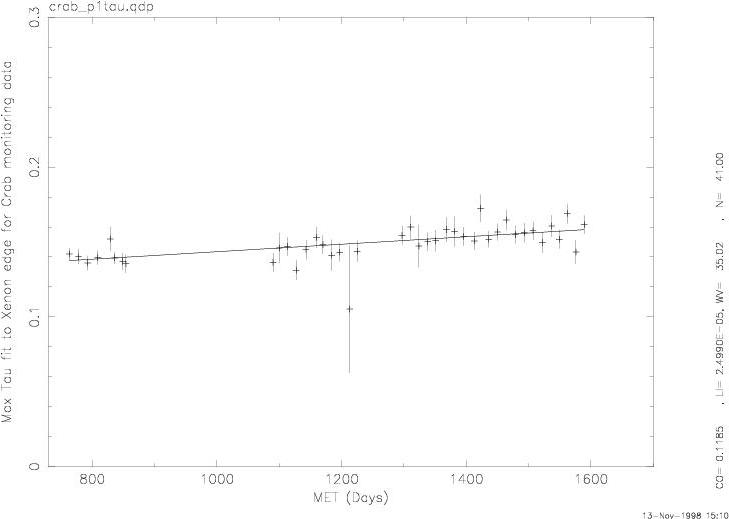 PCU 1
PCU 1
;
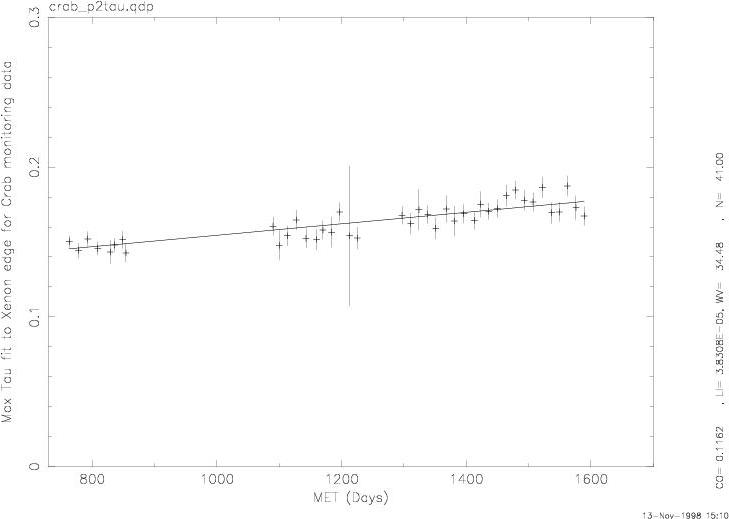 PCU 2
PCU 2
;
 PCU 3
PCU 3
;
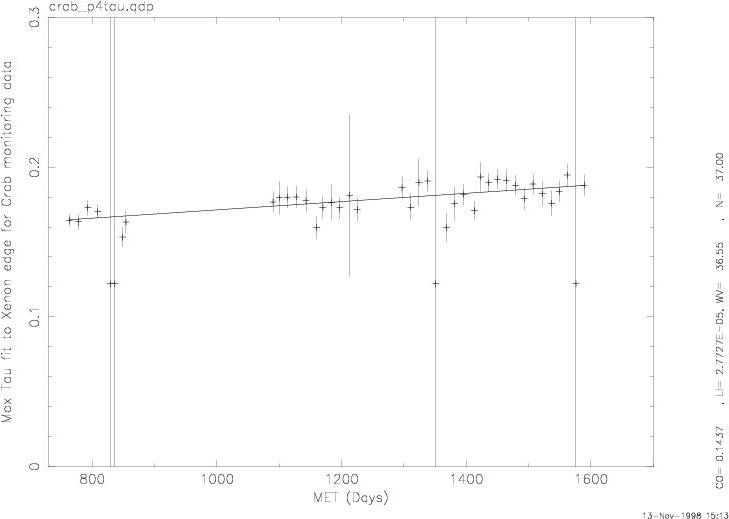 PCU 4
PCU 4
These results will be used to check our model of the time
dependence.
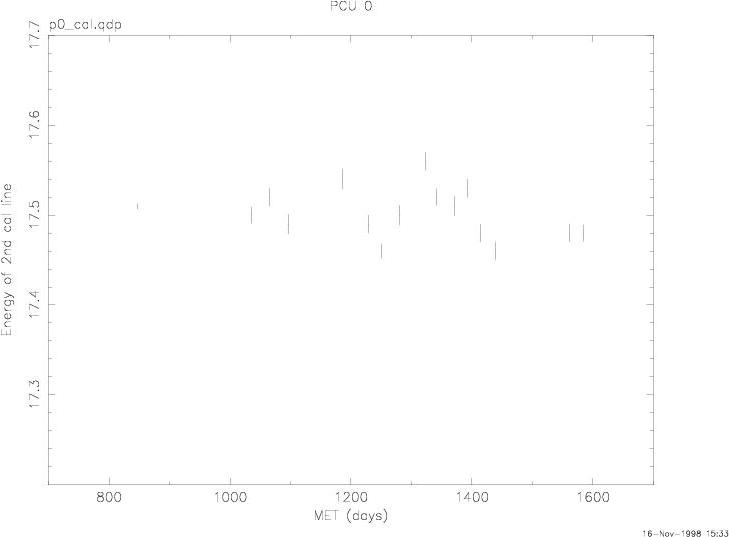
This Figure shows the energy fit to one
of the most prominent calibration lines for several periods throughout the first
two years of the mission (PCU 0 only).
notes prepared by Keith Jahoda, 16 Nov 1998