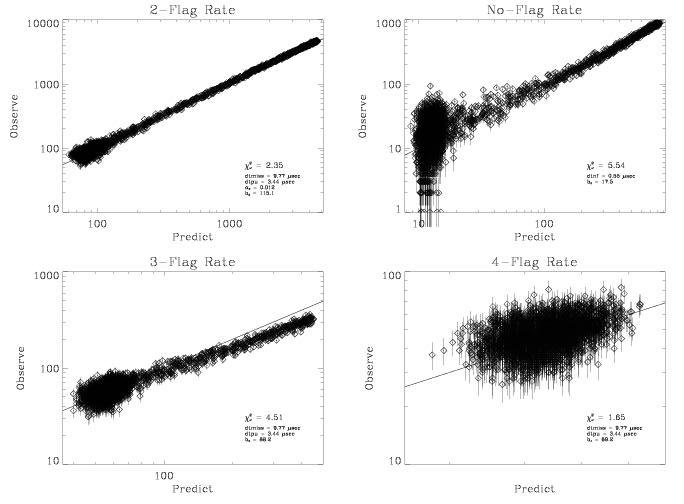
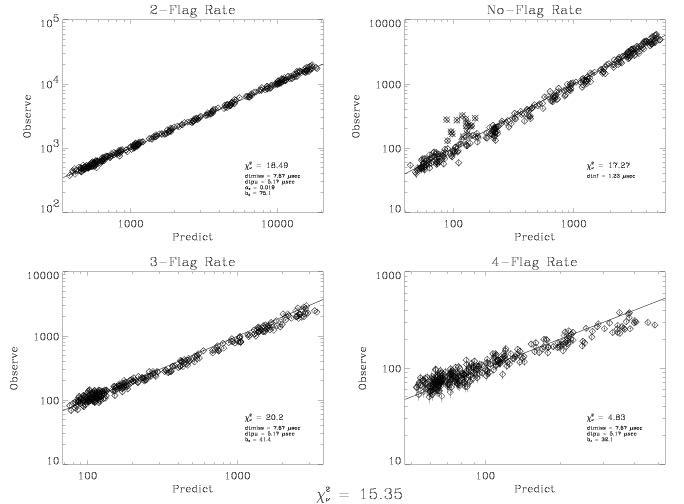
full_fit-sco.jpg and
full_fit-1744.jpg show how well my fits are faring,
when measured against the full datasets for Sco X-1 (former) and GRO
J1744-28 (latter). I make a simultaneous fit to the 2-flag, no-flag,
3-flag and 4-flag rates, varying my dtmiss, dtpu, and dtnf parameters,
after having determined all other parameters of the model in
single-rate fits.
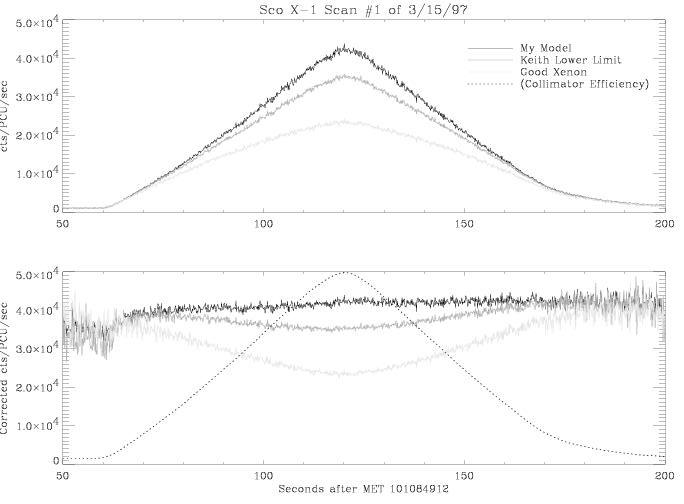
Scan1.jpg is a plot I made of the various deadtime corrections, applied
to the first scan over Sco X-1. The second panel shows how they fare
vis-a-vis the collimator transmission model (data grabbed from your
ftp area at Goddard). The "Upper Limit" correction is off the top of
the page here, so I did not include it.
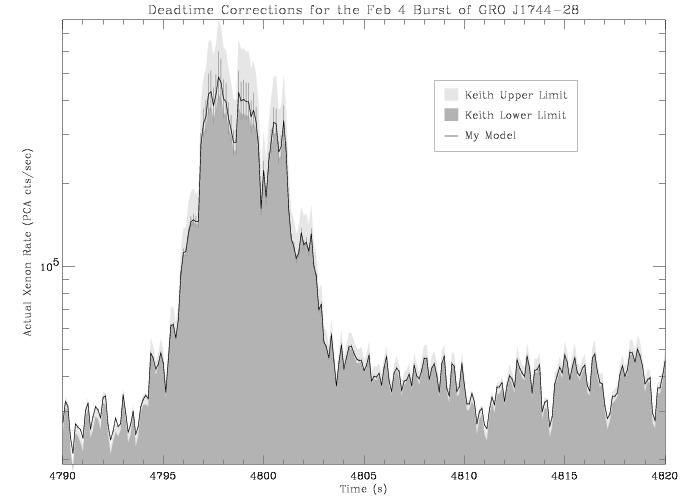
Feb4_Burst.jpg is a plot of the various deadtime corrections, applied
to that burst of GRO J1744-28 (I subtracted the background propane and
"remaining" rates before applying the lower- and upper-limit formulae,
however). Error bars on "My Model" indicate the results of using a
"dtmiss" value that is +/- 1 sigma from the best-fit value. (With a
larger dtmiss giving a higher incident count rate.)
(end of Derek's documentation)
I hope to have more details on Derek's model available for those who are
interested at the RUG. I may also have additional information on some
parallel investigations I have begun on the same subject.
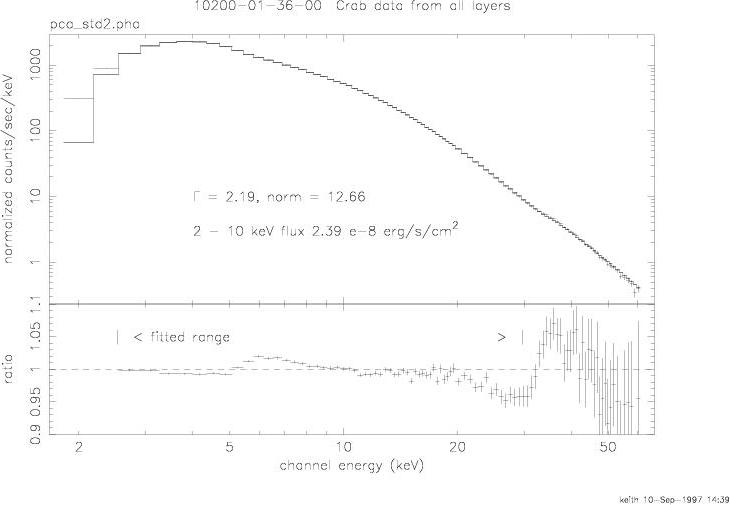
Energy Response:
v2.2.1.jpg - This plot shows the Crab, for all 5 detectors, all layers,
fit to a power law and the ratio of the model to the data. The absorbing
column was fixed at 3e21 / cm2. The index (2.19), normalization (12.66
phot/cm2/s/keV @ 1 keV), and 2-10 keV flux (2.39 e-8 erg/s/cm2) are
indicated on the plot. The fit was performed from 2.5-30 keV.
The ratio of data/model is within 2% of 1.0 over the fit range. Improvements
to be expected are
- inclusion of partial charge collection at the lowest energies
- improvement of the treatment around the K edge
- further smoothing of the bump near and just above the Xenon L edge.
- getting the instrument resolution right (currently somewhat to narrow,
at least near the Fe line)
Background:
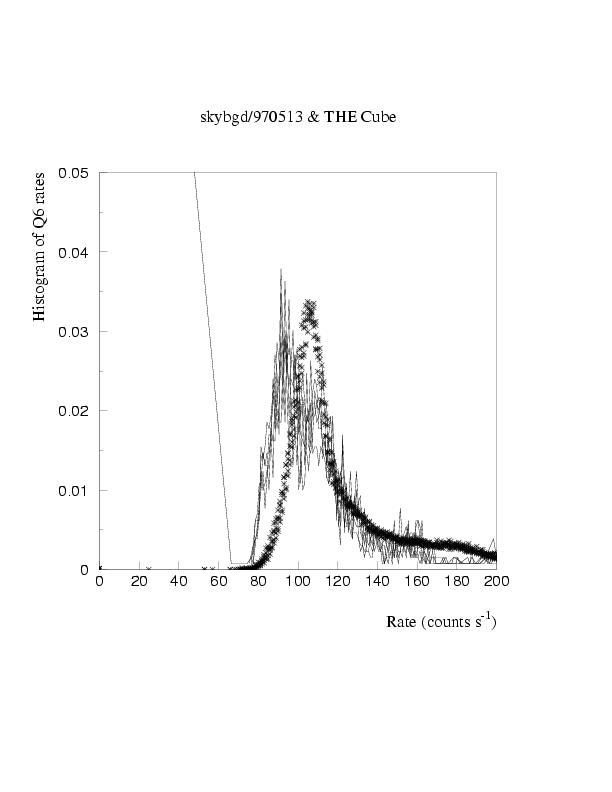
q6_rates.skybgd_occult.jpg :
This plot shows the distribution of q6 rates
(a rate sensitive to particles) for a large section of sky looking (solid line)
and earth looking (symbols) backgrounds. The distributions are DIFFERENT, which
calls into question whether earth looking data is really a good background template
for sky looking data.
(There could be a hidden parameter, but we haven't found it)
What are we doing in the meantime.
1) We have made some background "cubes", containing X-ray rates and numerous
other rates and SAA dose information. These cubes exist for sky and earth
looking data. Rick E. will present some results on an attempt to find
better predictors of the background rates.
2) We have made, and begun testing, a background model based on the blank sky
pointing data. I will try to present a preliminary, and promising, comparison
of the sky based model and the occult based model at the RUG. I will try to make
some plots available here on Sept 12, 1997.
3) Re-examination of the Ginga experience.
- our approach is not that different;
- both Hayashida and Awaki use earth looking data
- both apparently use counts in "signal free" parts of pulse height
spectrum (i.e. E < 6 keV on inner layer, pha of non sky viewing
anodes) to trace the activation components.
DESPITE THE FAMOUS PAPERS QUOTING TIME CONSTANTS FOR THE RADIO ACTIVE
DECAYS, IT APPEARS THAT THE TIME CONSTANTS DO NOT DIRECTLY APPEAR IN
THE MODELS. (just like our models)
4) We have identified a small long term increase in the background, and are
discussing ways to deal with it.
5) Optimistic (and not implausible) scenario:
Sky based models will be usefull and adequate when accompanied by a
correction factor derived separately for each observation. The correction
factor will be chosen to make the "source free" parts of the spectrum
"signal free" after correction and should be in the range 1+/- few percent.
Rick Edelson will present some results on ping pong related studies and issues
involved there.
While Rick will raise many legitimate and important concerns, I am pleased that he has chosen to submit several AO-3 proposals, and want to thank him for pushing us to improve the background models available to the RXTE user community.