Source Obstruction by ISS HardwareReturn to: Analysis Threads | Analysis Main Page
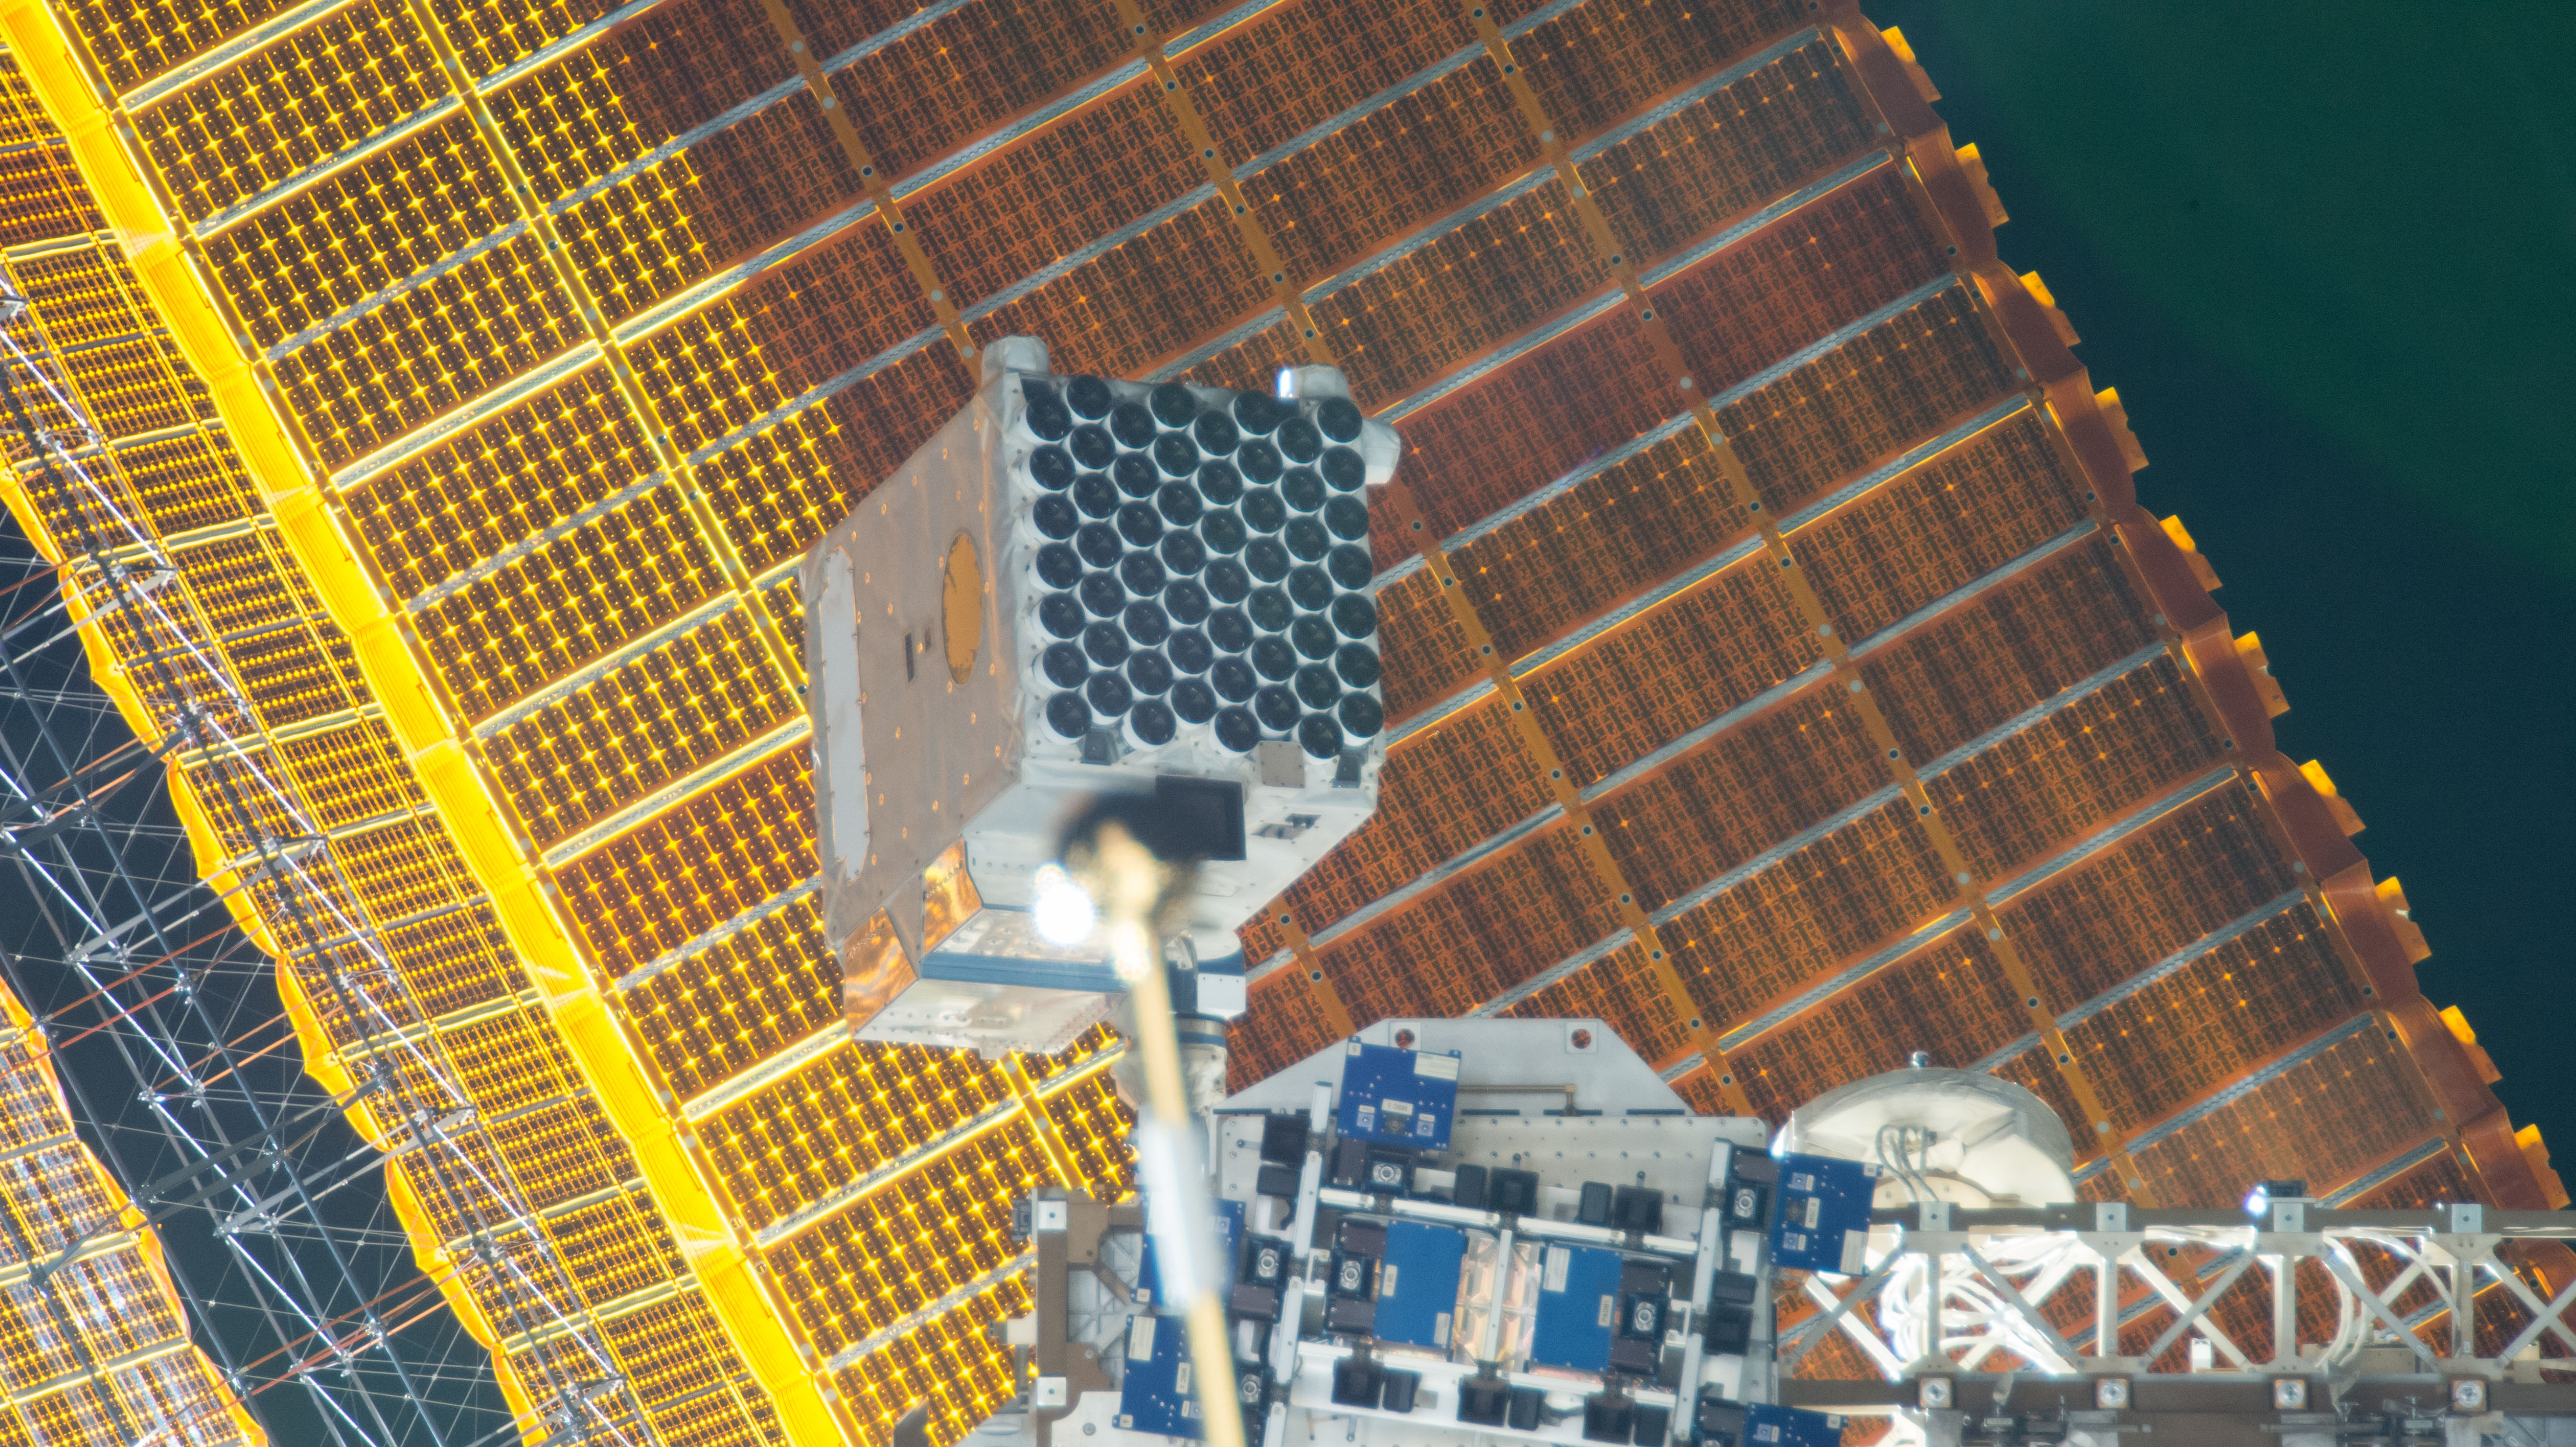
OverviewNICER is an attached payload on the International Space Station (ISS), and on rare occasions ISS hardware near NICER can obstruct the NICER X-ray Timing Instrument (XTI) view of the celestial targets. This will cause artificial variability which could be misconstrued as intrinsic variability of the target of the observation. Use this thread to assess whether your NICER source may have been obstructed by local ISS structures. Last update: 2021-04-16 IntroductionNICER is an attached payload on the International Space Station (ISS). Compared to free-flying space-based observatories, the ISS observing environment is crowded and busy. ISS hardware (like the wing-like ISS solar panels, thermal radiators, other attached payloads, and robotic manipulators like Canadarm2 or Dextre) can obstruct NICER's view of celestial targets. Such obstructions can cause artificial dips in count rate that might be mistaken for source variability. While NICER observation planners routinely avoid blockages by these components to the best of their ability, clearance tolerances are sometimes tight, and unanticipated changes to ISS operations may cause one of these components to obstruct all or part of the field-of-view of NICER's X-ray Timing Instrument (XTI) for some period of time. These unanticipated periods of obstruction will produce apparent variations (drops) in measured count rates. Artificial dips in count rate need to be understood and distinguished from real source variations. This is especially important for accreting X-ray binaries and other sources which are known to exhibit "dipping behavior". Observers should exercise caution before interpreting apparent drops in NICER count rate for their sources. Standard ScreeningTimes of ISS obstruction will usually be excluded by the standard screening applied by the NICER processing pipeline, but standard screening may not exclude all such times. Intervals of XTI focal plane obstruction that survive standard screening are most likely to occur during orbit night, since, in orbit day, Sun-lit ISS structures in front of the XTI focal plane will usually saturate the star tracker. This saturation results in times when ST_VALID = 0, and these times are rejected automatically by the nominal filtering criteria. During orbit night, the ISS structures are not illuminated by the Sun, so that physically narrow ISS structures can obstruct the XTI without saturating the star tracker, yielding times when ST_VALID = 1 even during times of focal plane obstruction. An Example of ISS Obstruction: 4U 1636-536 (ObsID 2050080212)
Here, we show how to identify times of ISS obstruction in NICER observations, using an observation of the accreting neutron star low mass X-ray binary 4U 1636-536 as an example. We offer some recommendations for determining whether dips observed in NICER count rate data are likely due to obstruction of the XTI field of view by some ISS obstruction. NICER observed 4U 1636-536 on Apr 28, 2019 (ObsID 2050080212). A lightcurve extracted using all active detectors shows a nearly symmetric drop in count rate lasting about 60 seconds (Figure 1). This drop is similar to absorption dips seen in some LMXBs.

Method 1: Look for Shadows Moving Across the XTI Focal PlaneA useful way to determine if such a dip is due to obstruction by some ISS structure is to examine lightcurves extracted using individual subsets of detectors. This is because ISS structures are narrower than the XTI focal plane, so that the shadow of any obstructing ISS hardware will usually move across the 52 focal plane modules (FPMs), shadowing some detectors before others. The shadow of an ISS structure will typically take several tens of seconds to move across the entire XTI focal plane. Variations due to an astrophysical target would appear simultaneously in all modules. Figure 2 shows that the dip seen in the lightcurve extracted from all the XTI Focal Plan Modules (FPMs) for ObsID 2050080212 (in black) is due to complete blockage (i.e. count rates = 0) of subsets of detectors. This blockage moves across the focal plane so that times of complete blockage are different in different groups of detectors. This is a clear signature of a moving shadow being cast across the detector array. In this case, the shadow moves from higher numbered detectors to lower numbered detectors.

Method 2: Examine NICER Star tracker dataObservers should also examine NICER house-keeping data that monitor the performance of NICER's star tracker. These data are available in the "makefilter" file (the *.mkf file found in the auxil sub-directory of a NICER observation directory). Several data types are useful for this purpose because the star tracker field of view is co-aligned with the XTI (X-ray) field of view:
 and ST_OBJECTS (blue) columns versus TIME")
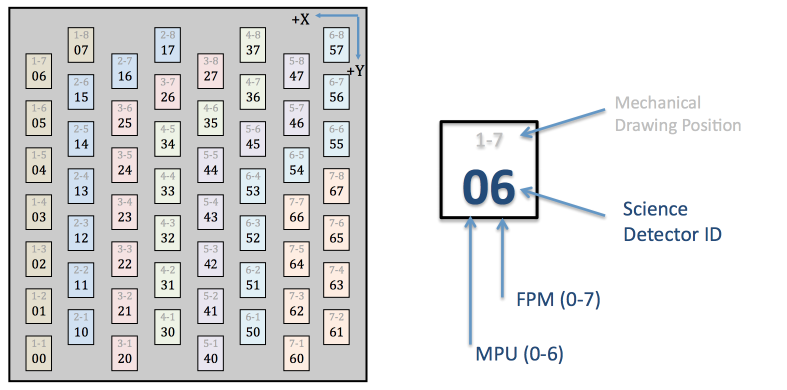
Method 3: Make Detector Images of each FPMOne can also make an image representing the count rates in each detector, using the RAWX and RAWY detector position information provided in the FITS event files. These data values are similar to DET_ID in that they uniquely identify each detector in the XTI focal plane. In this case, however, the values represent the X and Y position of each detector. Refer to the XTI focal plane map for the details of the detector layout.Figure 4 shows a sequence of 15 images in detector coordinates showing the count rates in each FPM in 5 second intervals during the time around the dip. In these images each pixel represents a count rate for that particular detector. The images are 8x7 pixels, representing the RAWX and RAWY positions of all 56 detectors (the 52 active detectors and 4 inactive ones). The time sequence of each image is labeled. Black regions in these images indicate an absence of counts in those FPMs. An obvious shadow diagonally moves across the detector plane from the top-left to lower right corners of the array. For comparison, the single frame at the bottom of Figure 4 is a 60 second detector image outside the dip, which shows a fully-illuminated detector plane. The four black pixels in this image, and the others as well, are the four inactive detectors. Figure 5 shows an animation of the shadow of the ISS obstruction moving across the field of view of the XTI, using the 15 frames from Figure 4.
SummaryObservers should check for moving X-ray shadows across the XTI detector array and examine the star tracker housekeeping data when unusual or interesting count rate dips are seen in NICER observations of astrophysical sources.Modifications
|


- HEASARC Director: Dr. Andy Ptak
- NASA Official: Dr. Andy Ptak
- Web Curator: J.D. Myers
- Last Modified: 16-Apr-2021