


Next: Off-axis Effective Area
Up: Effective Area
Previous: Effective Area
Figure 5.11
(which appeared as Figure 11.1 of Appendix F) is a plot of the
on-axis effective area of the XRT/HRI as a function of incident
energy; this function is tabulated in
Tab. 5.3 (Table 11.1 of Appendix F).
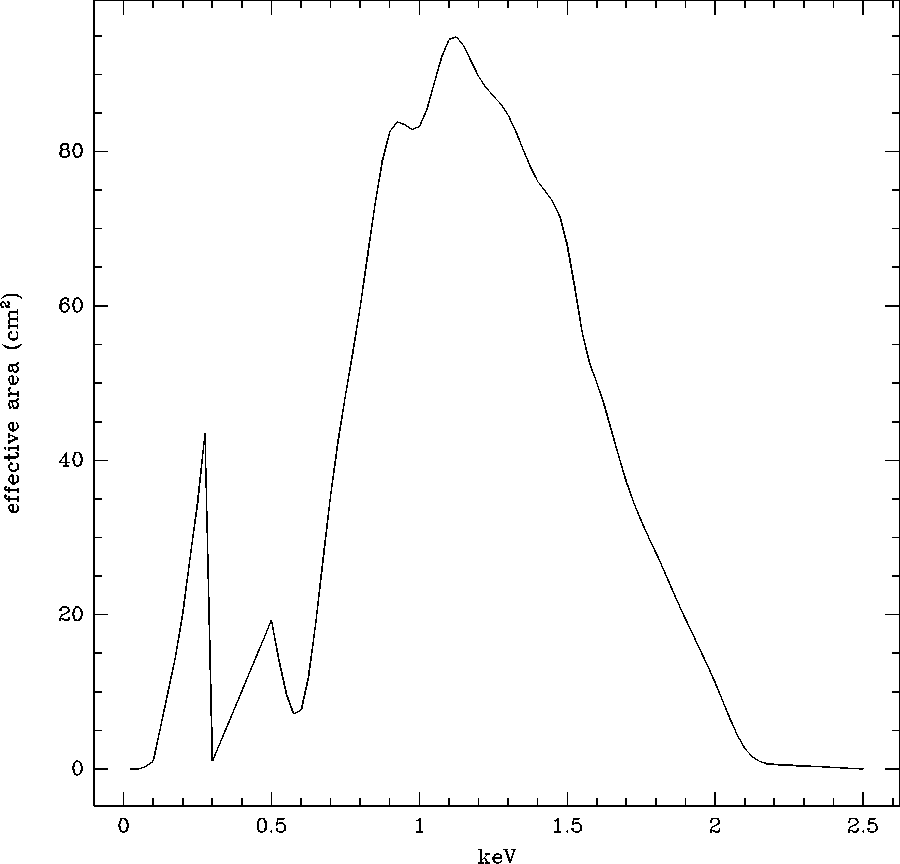
Figure 5.11: The on-axis effective area of the XRT/HRI vs. photon energy
|
Energy | Lambda | Effective Ares | Energy | Lambda | Effective Area |
|
keV | Å | cm  | keV | Å | cm  |
| 0.10 | 124.0 | 1.0 | 1.10 | 11.3 | 94.5 |
|
0.20 | 62.0 | 20.2 | 1.20 | 10.3 | 89.7 |
|
0.28 | 44.3 | 43.5 | 1.30 | 9.5 | 84.7 |
|
0.28 | 44.1 | 0.0 | 1.40 | 8.9 | 76.1 |
|
0.30 | 41.3 | 1.0 | 1.50 | 8.3 | 56.5 |
|
0.40 | 31.0 | 10.6 | 1.60 | 7.8 | 50.0 |
|
0.50 | 24.8 | 19.3 | 1.70 | 7.3 | 37.2 |
|
0.60 | 20.7 | 7.6 | 1.80 | 6.9 | 28.0 |
|
0.63 | 19.7 | 11.9 | 1.90 | 6.5 | 19.4 |
|
0.70 | 17.7 | 35.5 | 2.00 | 6.2 | 11.2 |
|
0.80 | 15.5 | 59.9 | 2.10 | 5.9 | 2.7 |
|
0.90 | 13.8 | 82.6 | 2.20 | 5.6 | 0.6 |
|
1.00 | 12.4 | 83.2 | 2.30 | 5.4 | 0.4 |
|
| | | 3.40 | 5.2 | 0.2 |
Table 5.3: The effective area of ROSAT XRT plus HRI
Next: Off-axis Effective Area
Up: Effective Area
Previous: Effective Area
If you have problems/suggestions please send mail to
rosat_svc@mpe-garching.mpg.de