This example shows how to generate a light-curve and save a user generated GTI file via cursor using XSELECT.
For further information on filtering within XSELECT, please refer to the manual.
$ xselect


                         **  XSELECT V2.4d  **

> Enter session name >[sel]
sel:SUZAKU > read event
> Enter the Event file dir >[./]
> Enter Event file list >[nu30202002004A01_cl.evt.gz] nu30202002004A01_cl.evt.gz
Got new mission: NUSTAR
> Reset the mission ? >[yes]

 Notes: XSELECT set up for      NUSTAR
 Time keyword is TIME       in units of s
 Default timing binsize =   5.0000

Setting...
 Image  keywords   = X          Y           with binning =    1
 WMAP   keywords   = X          Y           with binning =    1
 Energy keyword   = PI                     with binning =    1

Getting Min and Max for Energy Column...
Got min and max for PI:     0   4095

could not get minimum time resolution of the data read
MJDREF =  5.5197000766019E+04 with TIMESYS = TT
 Number of files read in:  1

******************** Observation Catalogue ********************

Data Directory is: /Users/nuhelp/30202002004/event_cl/
HK Directory is: /Users/nuhelp/30202002004/event_cl/


        OBJECT      OBS_ID      DATE-OBS
      1 WR140       30202002004 2016-11-11T12:36:08
The light curve can be filtered using the "filter" command in
XSELECT. Filter types include region, time, and energy channel
filtering. For example, if you are interested in the background,
then do not include the source in the region filter. Contrary, if
you are interested only in the source, then you only include a
region around the source. The region file used as input should be in
DS9 format. If you do not filter on a region (or time or energy),
you will get a light curve for the entire image (or the total
exposure or the full energy band). For further information on
filtering within XSELECT, please see the manual. In this example, we
select to create a source region filtered light curve that is then
filtered on time in order to remove flares due to high background.
sel:NUSTAR-FPMA > filter region region.reg
sel:NUSTAR-FPMA > set bin 100 ! set an appropriate time bin size in seconds
sel:NUSTAR-FPMA > extract curve
extractor v5.29 23 Apr 2016
Getting FITS WCS Keywords
Doing file: /Users/nuhelp/30202002004/event_cl/nu30202002004A01_cl.evt.gz[regfilter("sel_region.xsl",X,Y)]
100% completed
Total Good Bad: Time Phase Grade Cut
132939 132939 0 0 0 0
===============================================================================
Grand Total Good Bad: Time Phase Grade Cut
132939 132939 0 0 0 0
in 56413. seconds
Fits light curve has 132939 counts for 2.357 counts/sec
xsel:NUSTAR-FPMA > plot curve
PLT> quit
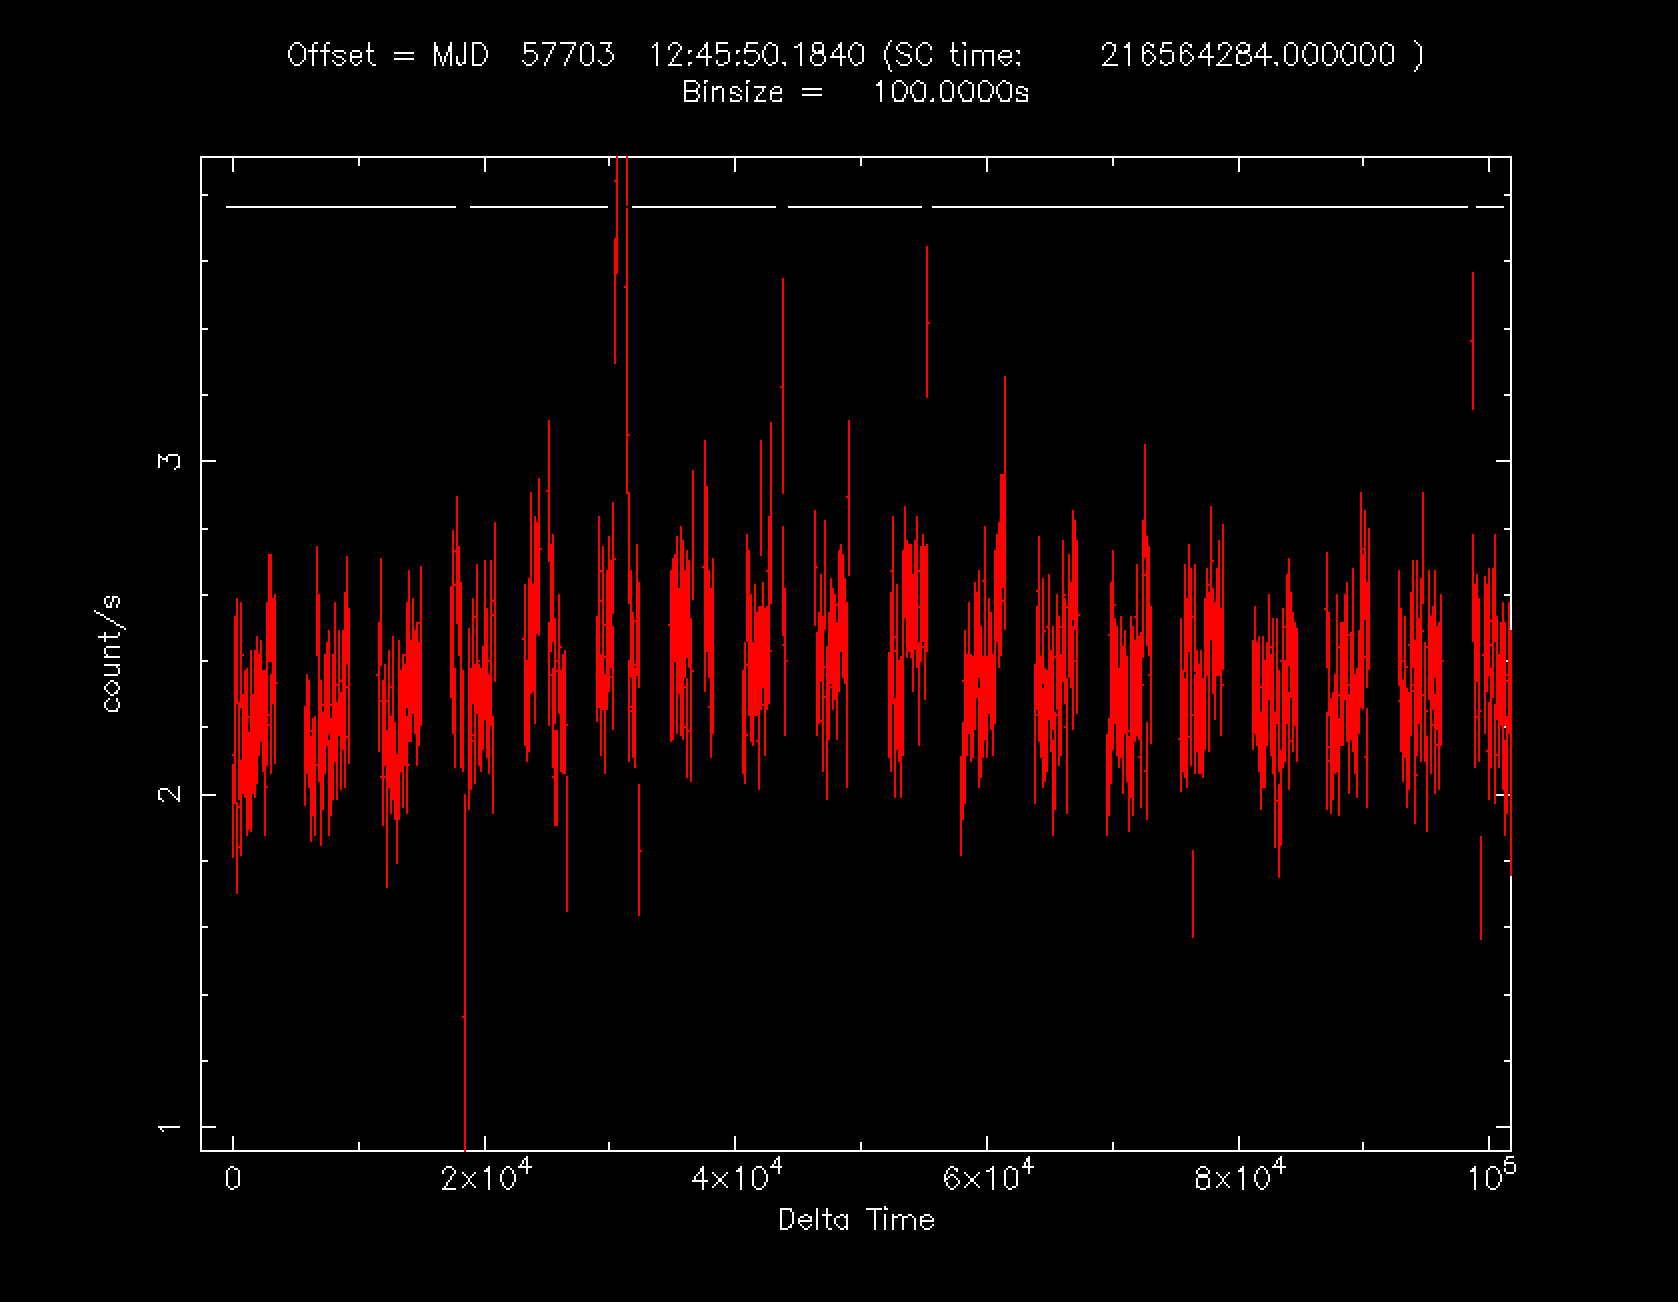
The light curve before excluding high background periods looks like Figure 1. We will select the GTIs via the cursor option.
For the cursor option, you need to type "quit" into the prompt before selecting the time ranges. After making your selections in the xwindow, type "x" within the window to exit.
Please refer to the instructions for other options.
Note that the white bars at the top of the plot designate the good time intervals.
IMPORTANT: It is critical to understand that the light curves produced by XSELECT have *NOT* been corrected for deadtime, effective area, or the PSF, so differences may be expected in rate and shape when compared to the light curves produced by the NuSTAR pipeline, which have had all these corrections applied. The light curves in XSELECT are only made to facilitate the selection of the GTI and should not be used for science. If you want to reproduce your light curve with the new GTI selections it must be done with nuproducts or nulccorr.
Figure 1: Light curve of the observation 30202002004.
sel:NUSTAR-FPMA > filter time
CURSOR --> Enter timing filter with the mouse
FILE --> Enter file containing timing filters
MJD --> Enter timing filter in MJD
QUIT --> Quit filter time
SCC --> Enter timing filter in SpaceCraft time
UT --> Enter timing filter in UT
> How do you want to enter your timing filter? >[cursor]
To start selection enter quit at the PLT prompt then
- to select a time range click the left mouse button on
the start time then again on the stop time. To cancel
the selection click the second time outside the plot.
- to exclude a time range press e on the keyboard when the
cursor is at the start time then again at the stop time
- press x on the keyboard to finish cursor selection and
return to the xselect prompt
- press c on the keyboard to cancel cursor selection and
return to the xselect prompt
- press p on the keyboard to return to the PLT prompt
Enter QUIT at PLT prompt to continue
PLT> quit
Writing timing selections to file sel_cursor_gti001.xsl
xsel:NUSTAR-FPMA > save time cursor ! save the GTIs to a named file
> Give output file name >[ni1120010120_0mpu7_cl] nu30202002004A01_cl.gti
We check the lightcurve using the new GTIs.
sel:NUSTAR-FPMA > ext curve
extractor v5.29 23 Apr 2016
Getting FITS WCS Keywords
Doing file: /Users/nuhelp/30202002004/event_cl/nu30202002004A01_cl.evt.gz[regfilter("sel_region.xsl",X,Y)]
100% completed
Total Good Bad: Time Phase Grade Cut
132939 122849 10090 0 0 0
===============================================================================
Grand Total Good Bad: Time Phase Grade Cut
132939 122849 10090 0 0 0
in 52455. seconds
Fits light curve has 122849 counts for 2.342 counts/sec
sel:NUSTAR-FPMA > plot curve
sel:NUSTAR-FPMA > quit
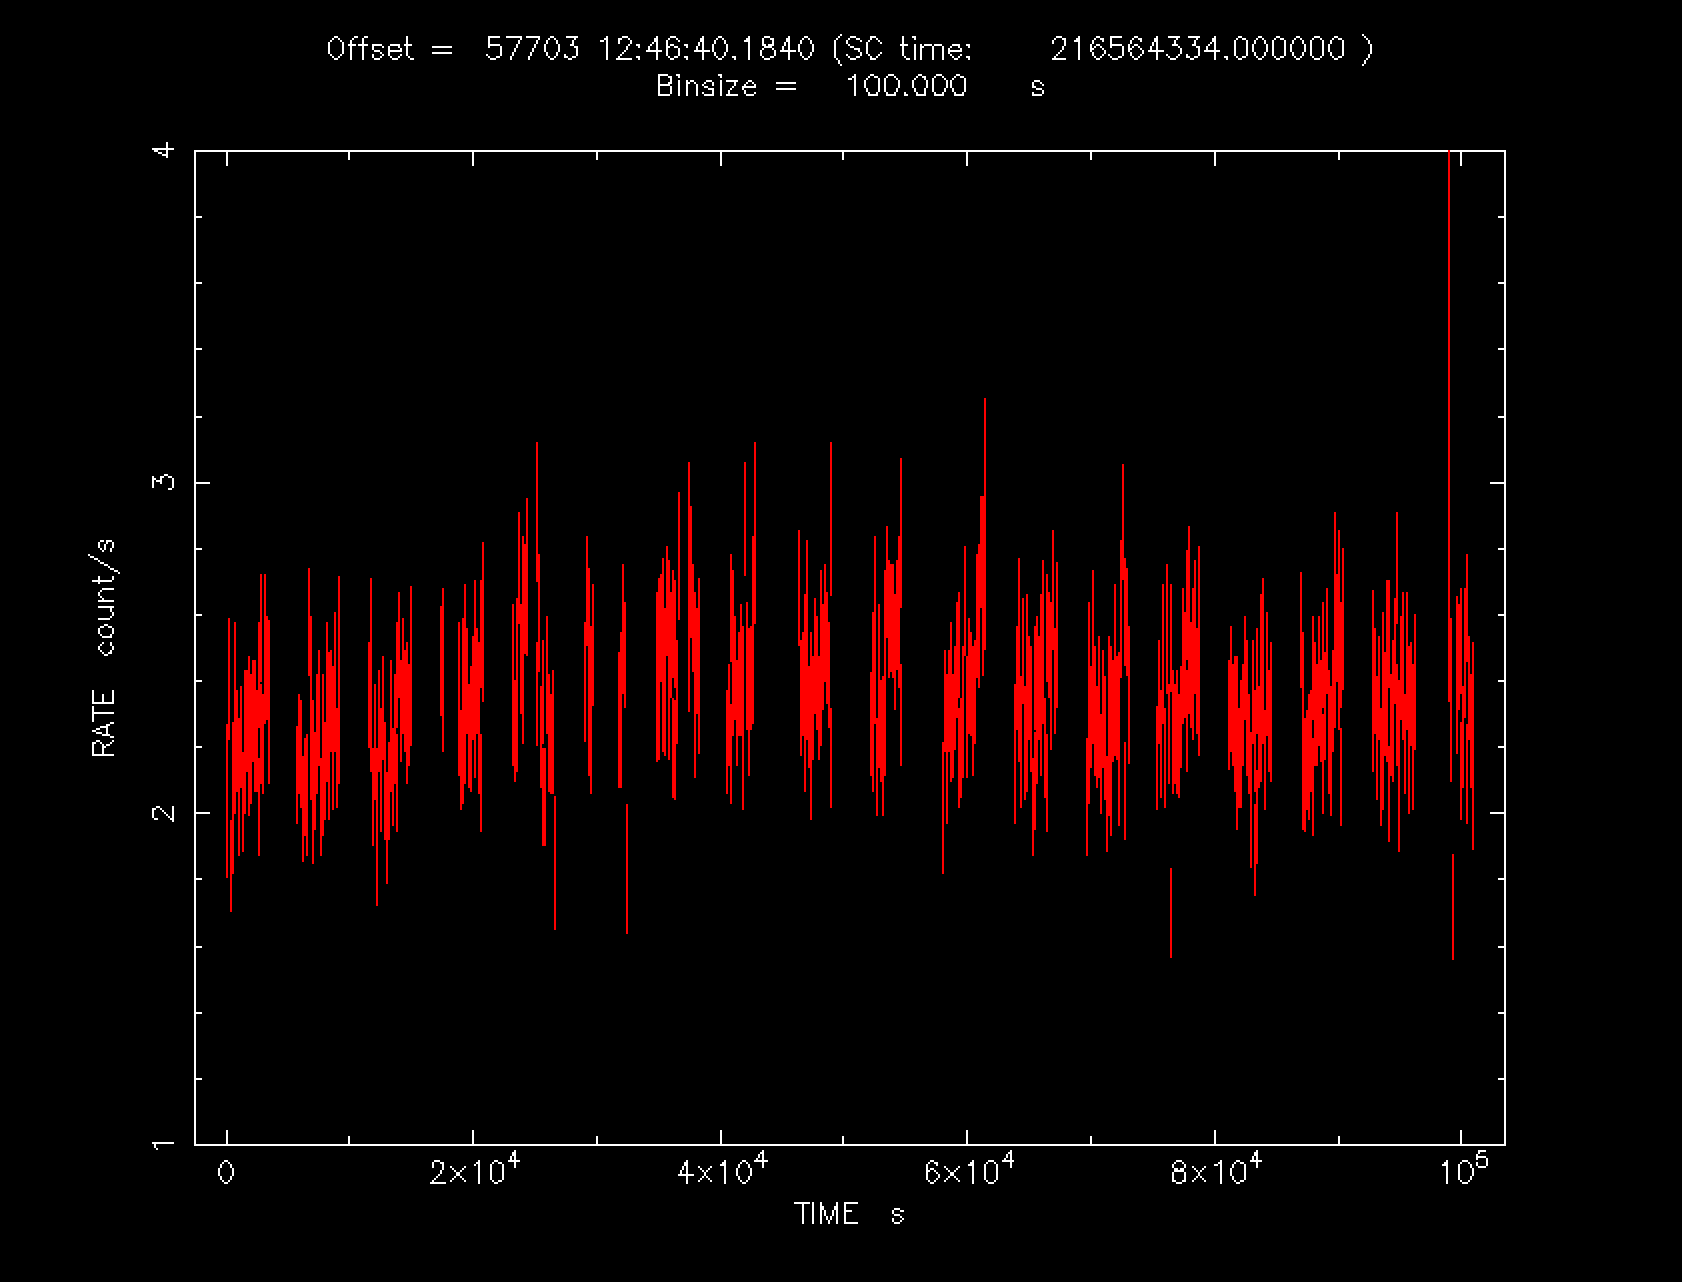
The filtered light curve looks like Figure 2. The saved GTI file "nu30202002004A01_cl.gti"
can be provided as input to nuproducts using the "usergti"
parameter.
Figure 2: Light curve after excluding high background periods.
Note: If you do multiple cursor selections, i.e. close the selection window and open it up again to do another, they all add up when you finally do save. This also means if you made a mistake you should do a "clear time cursor" first before proceeding with your new selection.