% ximage
******************************************************************************
*                              Welcome to XIMAGE                             *
******************************************************************************

                                                          Type "help" for help


                                           VERSION 4.5.1  13:28:15 19-Oct-2011

 No of detectors read in:   30
[XIMAGE>
[XIMAGE> read
 Enter file name:rp200108n00_im1.fits.Z
 Telescope ROSAT PSPCB
WARNING:  assuming DRPIX based on mission info
 Image size = 512 x 512 pixels
 Image rebin = 30.00
 Image center = 7680.5, 7680.5
 Reading an image
  Image level, min = 0.0000000 max = 48.000000
 Copied MAP1 to MAP9
[XIMAGE> read exposure
 Enter file name:rp200108n00_mex.fits.Z
 Telescope ROSAT PSPCB
WARNING:  assuming DRPIX based on mission info
 Image size = 512 x 512 pixels
 Image rebin = 30.00
 Image center = 7680.5, 7680.5
 Reading an image
  Image level, min = 0.0000000 max = 1601.5461
[XIMAGE> cpd /xtk
[XIMAGE> display
 Plotting image
  Min =   0.0000000      Max =    48.000000
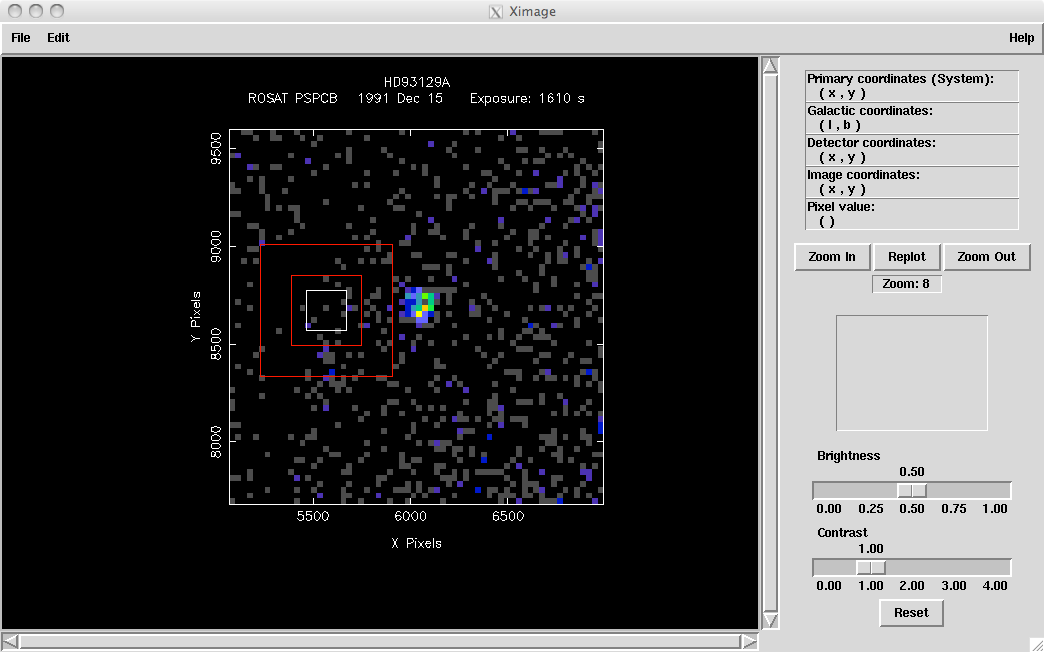
Display of zoomed in region of rp200108n00_im1.fits. Boxes show the regions used for SOSTA, chosen interactively via the cursor.
[XIMAGE> sosta
 Using MAP1
 Using a locally computed background
 Select the center of source box (Right button exits)
                    X = 5568.6411    Y = 8672.2266
  Using average energy for PSF:    1.0000000
 Source half-box for 0.66 EEF is  103.1 pixels
        Half-box for 0.90 EEF is  170.1 pixels
 Total # of counts 6.0000000 (in 37800 elemental sq pixels)
 Background inner radius:  179.0 pixels; outer radius:  340.1 pixels
 Innerbox counts 19.000000 in 129600 sq or pixels
 Outerbox counts 63.000000 in 455400 sq or pixels
 Background counts 44.000000 in 325800 sq pixels
 Vignetting is part of exposure map
 Background/elemental sq pixel :                1.351E-04 +/- 2.0E-05
 Background/elemental sq pixel/sec :            1.725E-07 +/- 2.6E-08

 Source counts :                                8.950E-01 +/- 2.6E+00
 s.c. corrected for PSF + sampling dead time
                                + vignetting    1.328E+00 +/- 3.8E+00
 Source intensity :                             1.143E-03 +/- 3.3E-03 c/sec
 s.i. corrected for PSF + sampling dead time
                                + vignetting -> 1.696E-03 +/- 4.9E-03 c/sec
 Signal to Noise Ratio             :            3.486E-01
                                                 Poisson    Gauss
 Pr. that source is a fluctuation of back. :    4.02E-01   3.46E-01


    Vignetting corrected exposure :        782.847 s
    Sampling dead time correction :      0.968
    PSF correction                :      1.532

      Three sigma upper limit : 2.37E-02 cts/s
    Optimum half box size is      : 106.50000 orig pixels
     Error radius :   20. arcsecs
Page Author: Michael F. Corcoran
Last modified Tuesday, 19-Oct-2021 15:47:10 EDT
 Select another FAQ topic
 Return to the ROSAT GOF
Please use the Feedback link if you have questions on ROSAT.