XMM-Newton
Users Handbook
3.3.4 Intrinsic energy resolution of EPIC
The CCD pixels of the EPIC cameras are energy sensitive, enabling
non-dispersive spectroscopy. The resolving power of these cameras is
determined by the intrinsic energy resolution of the individual pixels.
The spectral resolution for a point source located at the nominal
pointing position of both the EPIC MOS and pn CCDs, as a function of
energy, is displayed in Figs. 25 and
26. Also plotted in Fig. 25
are the measured in-flight  of the Al K
 and Mn K
on-board calibration lines, after correction for charge transfer inefficiency
(CTI) by the SAS, obtained in five different orbit ranges.
The energy resolution of the MOS camera suffered a rapid degradation
by
and Mn K
on-board calibration lines, after correction for charge transfer inefficiency
(CTI) by the SAS, obtained in five different orbit ranges.
The energy resolution of the MOS camera suffered a rapid degradation
by  10% during the early mission. The resolution was brought back
to pre-launch values by decreasing the operational temperature. This
“cooling” was performed between November and December 2002
(Rev.#530 to #560). Since then, the energy resolution of the MOS cameras
is basically constant (Fig. 25).
For the pn camera, a constant degradation of the energy resolution
with a rate of 2.5 eV yr
10% during the early mission. The resolution was brought back
to pre-launch values by decreasing the operational temperature. This
“cooling” was performed between November and December 2002
(Rev.#530 to #560). Since then, the energy resolution of the MOS cameras
is basically constant (Fig. 25).
For the pn camera, a constant degradation of the energy resolution
with a rate of 2.5 eV yr is measured.
Figure 25:
Temporal evolution of the EPIC MOS energy resolution (FWHM) as a
function of energy. The solid curve is a best fit  function to
ground calibration data between 0.1 and 12 keV; all events with pattern
0-12 were included in the analysis. Below around 0.6 keV (shown by the
dotted region) surface charge loss effects distort the main photo peak
significantly from a Gaussian and hence the effective energy
resolution. The data points represent MOS 1 in-flight measurements of
the FWHM of the Al
function to
ground calibration data between 0.1 and 12 keV; all events with pattern
0-12 were included in the analysis. Below around 0.6 keV (shown by the
dotted region) surface charge loss effects distort the main photo peak
significantly from a Gaussian and hence the effective energy
resolution. The data points represent MOS 1 in-flight measurements of
the FWHM of the Al  (1.478 keV) and Mn
(5.893 keV) lines in five different epochs. It should be noted the rapid
degradation of the resolution between the first and the second epoch,
and the recovery and subsequent stability after the cooling of the MOS
camera (performed between November and December 2002, i.e.
between Rev.#530 and Rev.#560. In the main panel measurement
error bars are smaller than the symbol size. In the insets a
zoom of the spectral ranges around the nominal line positions is shown.
Typical standard deviations in each epoch range between 3 and 7 eV, and
8 and 18 eV for the Al and Mn line, respectively.
(1.478 keV) and Mn
(5.893 keV) lines in five different epochs. It should be noted the rapid
degradation of the resolution between the first and the second epoch,
and the recovery and subsequent stability after the cooling of the MOS
camera (performed between November and December 2002, i.e.
between Rev.#530 and Rev.#560. In the main panel measurement
error bars are smaller than the symbol size. In the insets a
zoom of the spectral ranges around the nominal line positions is shown.
Typical standard deviations in each epoch range between 3 and 7 eV, and
8 and 18 eV for the Al and Mn line, respectively.
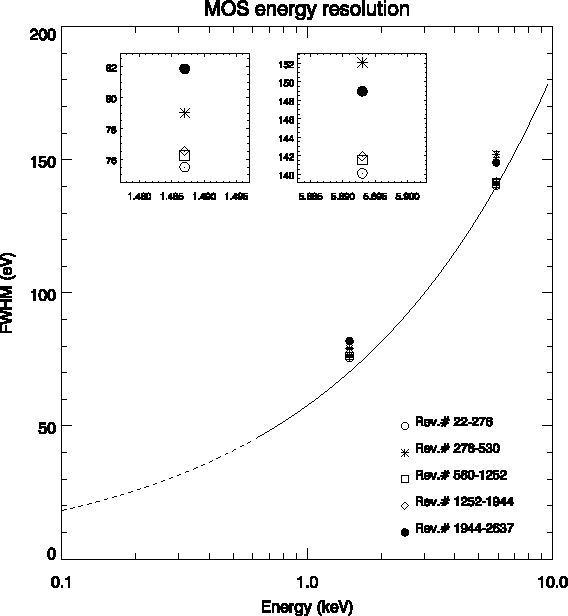 |
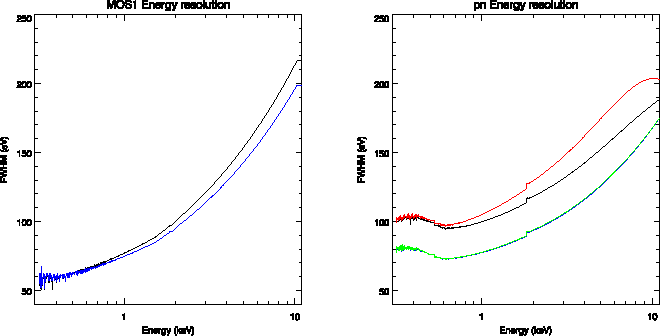
Figure 26:
Left panel: MOS 1 energy resolution as a function of energy for singles
(blue) and singles+doubles (black) events. Right panel: pn energy resolution as a
function of energy for: a) single events at the boresight (position "Y9" in the canned
response matrices; black); b) single+double events at the boresight position (red);
c) single events close to the readout node (position "Y0", blue); d) single+double
events close to the readout node (green). Line widths are based on monochromatic
line spectra, simulated with the SASv11.0 canned response matrices.
 |
European Space Agency - XMM-Newton Science Operations Centre