Next: 3.3.11 EPIC event grade selection Up: 3.3 EUROPEAN PHOTON IMAGING CAMERA (EPIC) Previous: 3.3.9 EPIC photon pile-up
For the EPIC imaging modes, photons are not only registered during the actual integration interval but also during the readout of the CCD (shift of charges along a column towards the readout node). These so called Out-of-Time (OoT) events get a wrong RAWY value assigned and thus finally a wrong CTI correction. The magnitude of this effect scales with the ratio of readout time and integration time. Table 6 summarises the relevant parameters.
| MOS Mode | Life time with OoT events [%] | Fraction OoT [%] |
| Full frame | 100.0 | 0.35 |
| Large window | 99.5 | 0.5 |
| Small window | 97.5 | 0.5 |
| pn Mode | Life time with OoT events [%] | Fraction OoT [%] |
| Full frame | 99.9 | 6.3 |
| Ext. full frame | 100.0 | 2.3 |
| Large window | 94.9 | 0.16 |
| Small window | 71.0 | 1.1 |
The effect of OoT events broadens spectral features in a systematic way:
assume a bright point-like source above CCD pixel RAWY_S then the OoT
events with RAWY  RAWY_S will be undercorrected (and thus
get a too low energy) while the ones for RAWY
RAWY_S will be undercorrected (and thus
get a too low energy) while the ones for RAWY  RAWY_S will
become overcorrected (too high energy).
RAWY_S will
become overcorrected (too high energy).
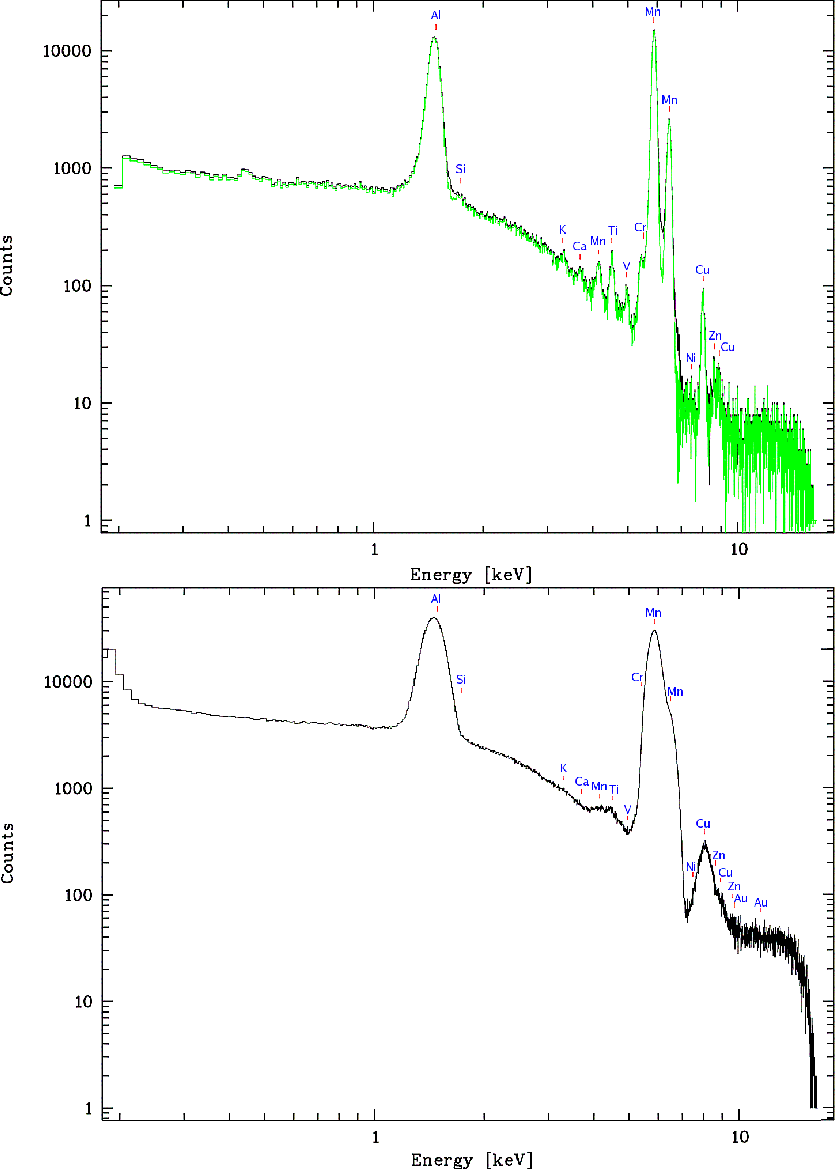
This effect is illustrated in Fig. 41 using the internal calibration source (CalClosed filter position) as a quasi example of a bright extended source with a line spectrum. Note the significantly broadened features in the OoT spectrum.
 |
The effect on images is shown in Fig. 42 (also note the arc-like structures due to single mirror reflections at the top left of the FoV; see § 3.2.4).
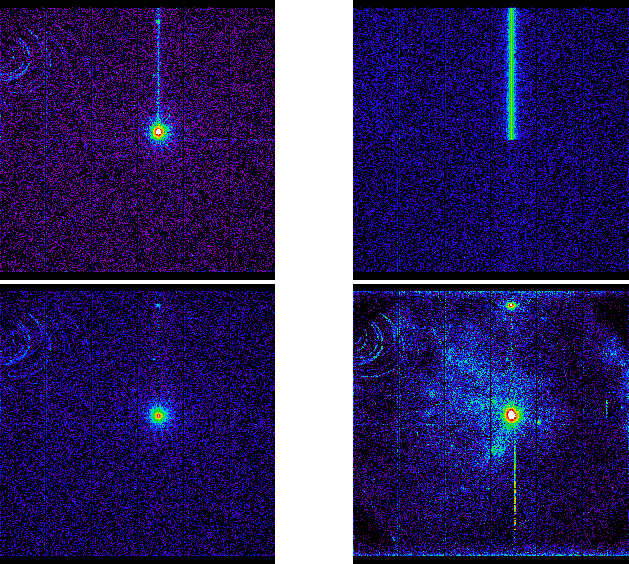 |
The OoT events are not only affecting the central source itself but also the region between the source and the readout node. In Fig. 42 for example a source is located close to the upper edge just along the readout direction of the bright central source. Also the spatial and spectral analysis of any extended emission (as visible e.g. in the lower right panel of Fig. 42) can significantly be hampered by OoT events.
If a performed EPIC-pn observation is affected by OoT events, the SAS task epchain can be used to create a simulated OoT events list. Images and spectra extracted from this OoT events list should be subtracted from images and spectra produced from the original events list to clean these products from the effects of OoT events.
In Fig. 43 we show an example on how the EPIC-pn camera works in Small Window mode. The process is as follows:
|
European Space Agency - XMM-Newton Science Operations Centre