XMM-Newton Users Handbook


3.2.1.1 On-axis PSF

Each of the three Wolter-type X-ray telescopes on board XMM-Newton has its own 
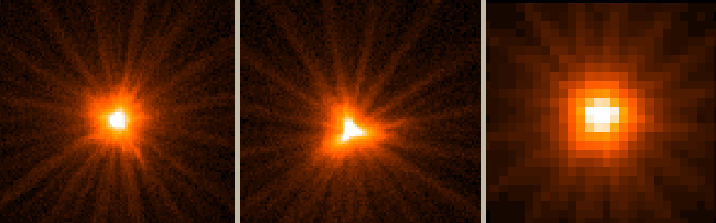
point-spread function (PSF). As an example, Fig. 4 shows the in orbit on-axis PSF of the MOS1, MOS2 and pn X-ray telescopes, registered on the same source. This figure is primarily provided to show the shape of the PSF, with for example the radial substructures caused by the spiders holding the mirror shells. Values for the full width at half maximum ($FWHM$) and half energy width ($HEW$) of the PSFs (both in-orbit and ground measurements) are listed in Table 2.

Figure 4: On axis point spread function (PSF) of the MOS1, MOS2 and pn X-ray telescopes (left to right) registered on the same source with each MOS camera in Small Window mode, and the pn camera in Large Window mode. The pixel size is 1.1 arcsec square for the MOS, and 4.1 arcsec square for the pn. The images are 110 arcsec wide. A square root scale has been used to visualise the wings of the PSF. The core of the PSF is piled-up for this source, with a different factor for the MOS and the pn. The star-like pattern is created by the spider which supports the 58 co-axial Wolter I mirrors of the telescope. The shape of the PSF core is slightly different for all cameras, with MOS2 having a somewhat more pronounced shape.
\begin{figure}\begin{center}
\leavevmode
\epsfig{width=1\hsize, file=figs/PSFimage.ps}
\end{center}
\end{figure}


Table 2: The on-axis in orbit and on ground 1.5 keV PSFs of the different X-ray telescopes
Mirror module 2 3 4
Instr. chain$^a$ pn MOS-1+RGS-1 MOS-2+RGS-2
  orbit/ground orbit/ground orbit/ground
FWHM$''$] $<12.5^b$/6.6 4.3/6.0 4.4/4.5
HEW$''$] 16.6/15.1 16.8/13.6 17.0/12.8
Notes to Table 2:
a) The instruments located behind the mirror module.
b) The core of mirror module 2 cannot be better resolved in orbit because of the large pn-CCD pixel size.

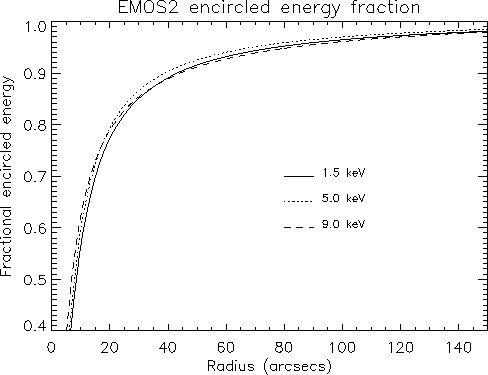
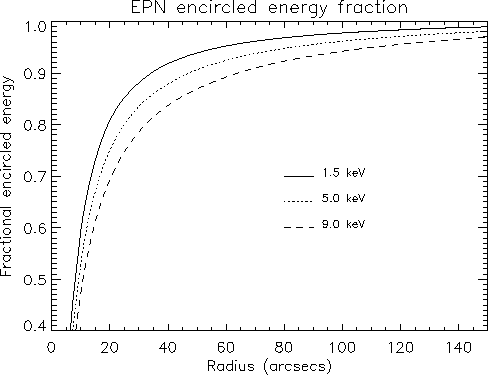
Figs. 5, 6 and 7 show the fractional encircled energy as a function of radius from the centre of the PSF for several different energies as it is currently implemented in the current calibration file (CCF, ELLBETA mode).

Please note that the PSF measurements by the EPIC cameras might depend on the instrument readout mode, through combinations of out-of-time event smearing and/or pile-up. The PSF can be severely affected by pile-up effects when the count rate exceeds a few counts per frame. Depending on the selection of event types in the EPIC event analysis process, a hole can even appear in the core of the PSF due to the lack of events whose reconstructed energy is above the onboard high-energy rejection threshold (see § 3.3.9).

Figure 5: The MOS1 fractional encircled energy as a function of angular radius (on-axis) at different energies. The curves were calculated integrating the PSF that is currently implemented in the CCF.
\begin{figure}\begin{center}
\leavevmode
\epsfig{height=0.55\hsize, clip=true, file=figs/EMOS1_ELLBETA_EEF.ps}
\end{center}
\end{figure}

Figure 6: The MOS2 fractional encircled energy as a function of angular radius (on-axis) at different energies. The curves were calculated integrating the PSF that is currently implemented in the CCF.
\begin{figure}\begin{center}
\leavevmode
\epsfig{height=0.55\hsize, clip=true, file=figs/EMOS2_ELLBETA_EEF.ps}
\end{center}
\end{figure}

Figure 7: The pn fractional encircled energy as a function of angular radius (on-axis) at different energies. The curves were calculated integrating the PSF that is currently implemented in the CCF.
\begin{figure}\begin{center}
\leavevmode
\epsfig{height=0.55\hsize, clip=true, file=figs/EPN_ELLBETA_EEF.ps}
\end{center}
\end{figure}

European Space Agency - XMM-Newton Science Operations Centre