Next: 3.7.1.3 XMM-Newton EPIC vs. Chandra ACIS-I pile-up comparison Up: 3.7.1 A comparison of XMM-Newton vs. Chandra Previous: 3.7.1.1 Effective area for dispersive spectroscopy
For illustrative purposes,
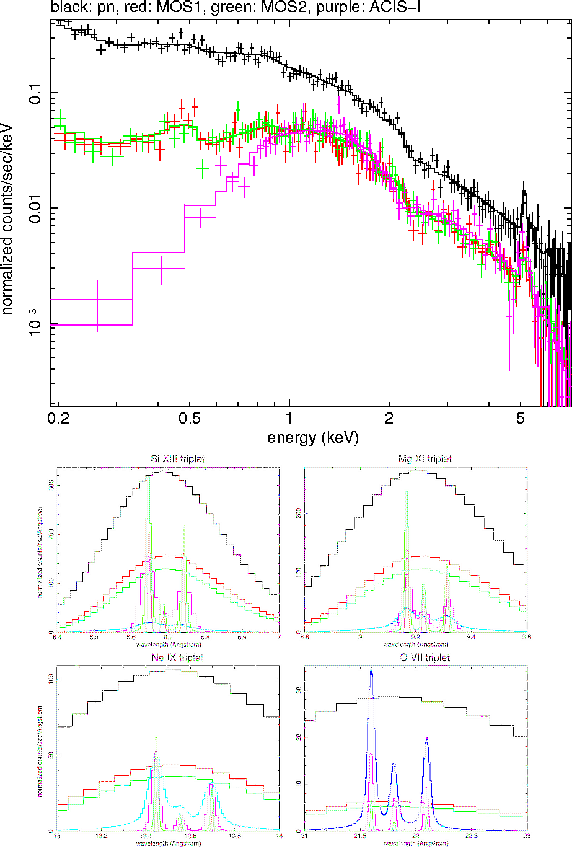
Fig. 117 shows a comparison of an XMM-Newton EPIC and a Chandra ACIS-I observation of a cluster with a 6 keV thermal
plasma spectrum, 0.3 solar metallicity, a redshift of 0.3 and an X-ray flux in
the 0.1-10 keV band of 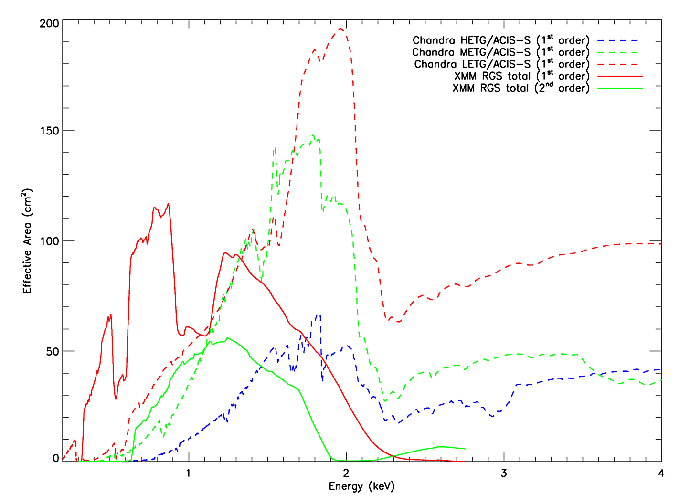 erg cm
 s
s (thus a fairly
luminous system). Such a comparison gives a good feel for the capabilities of
both instruments for performing studies of faint objects. We simulated the
response of the Chandra ACIS front-illuminated CCD imaging instrument, using
the response matrices supplied for the guest observer proposal
submission. With a 30 ksec observation, ACIS is able to measure the temperature
of the cluster to about 10% accuracy (assuming only poissonian noise and
neglecting systematic effects). Following the same procedure, i.e., up-to-date
detector response matrices, input spectrum and observing time, the combined
response of the 3 EPIC focal plane cameras on XMM-Newton allows a 2.5% accuracy
on the estimated cluster temperature (neglecting systematic effects).
(thus a fairly
luminous system). Such a comparison gives a good feel for the capabilities of
both instruments for performing studies of faint objects. We simulated the
response of the Chandra ACIS front-illuminated CCD imaging instrument, using
the response matrices supplied for the guest observer proposal
submission. With a 30 ksec observation, ACIS is able to measure the temperature
of the cluster to about 10% accuracy (assuming only poissonian noise and
neglecting systematic effects). Following the same procedure, i.e., up-to-date
detector response matrices, input spectrum and observing time, the combined
response of the 3 EPIC focal plane cameras on XMM-Newton allows a 2.5% accuracy
on the estimated cluster temperature (neglecting systematic effects).
The bottom panel of Fig. 117 also illustrates the different line spectral resolution that XMM-Newton EPIC and RGS and the Chandra ACIS instruments can achieve.
The presented count spectra comparisons are based on year 2008 responses. For data of different mission epochs the actual appearance of the count spectra comparisons, especially at the low energies, varies due to the different level of contamination of various instruments at different epochs. The losses of effective areas due to contamination are corrected by the correspondent instrument calibrations.
 |
European Space Agency - XMM-Newton Science Operations Centre