Next: 3.4.4.3 RGS spectral resolution for extended sources Up: 3.4.4 In-Flight Performance Previous: 3.4.4.1 The Line Spread Function
Although the built differences between the two RGS units are small, the energy resolutions of the two instruments are slightly different due to their slightly different focusing as shown in Fig. 82.
The shape of the LSF core largely determines the ability of the
spectrometer to separate closely spaced emission lines. The various
components scale differently with wavelength, giving rise to a composite
line shape which cannot easily be characterised in terms of a simple
analytical function. The telescope blur contributes a constant term to
the spectrometer line width, while misalignments and flatness errors of
the gratings contribute a term which slowly increases with increasing
wavelength. The broadening due to pointing instability, which affects
the resolving power through variations of the angle of incidence on the
gratings has proved to be negligible. The scattering component is most
significant at the shortest wavelengths and the highest diffraction
orders. This is illustrated in Fig. 82 where the
predicted resolution (the FWHM of the LSF) for the two RGSs is shown in
the second and fourth panels. The steep rise below 7 Å is due to the
scattering component of the gratings. Also shown are the measurements,
which are deduced from narrow, bright emission lines in HR 1099
(Ly lines of Ne, O, N and C). Fig. 82
demonstrates that the instrument resolving power is close to
expectations.
lines of Ne, O, N and C). Fig. 82
demonstrates that the instrument resolving power is close to
expectations.
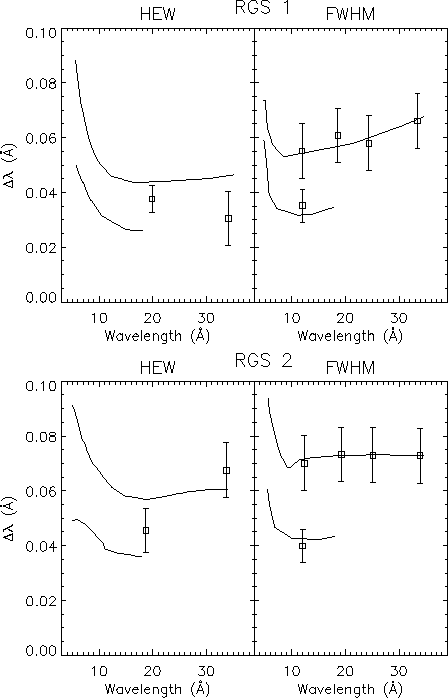 |
The ability to detect weak emission lines above the background or the
continuum is better measured by the half energy width (HEW) of the
profile. This width, especially at short wavelengths, is more dependent
on the amplitude and width of the scattering wings. Again, the data
agree with the predictions and, in the HEW sense, the resolving power
goes to  800 at the longest wavelengths. The first and third
panels of Fig. 82 display the HEW as a function
of wavelength, for both RGS units separately.
800 at the longest wavelengths. The first and third
panels of Fig. 82 display the HEW as a function
of wavelength, for both RGS units separately.
European Space Agency - XMM-Newton Science Operations Centre