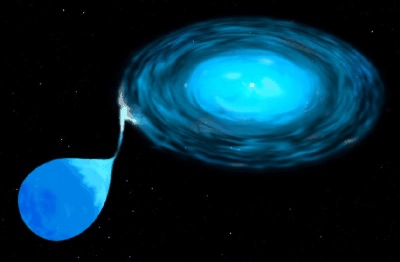
Credit: HST Artist's Impression In July 1996 RXTE observed an outburst in XY Arietis, an interacting binary star with a magnetized accreting white dwarf. This is only the second time that an outburst in X-rays has been seen from this type of system. XY Ari lies behind a molecular cloud and so cannot be studied at optical wavelengths. The two stars in this binary orbit each other every 6.06 hours and the magnetic white dwarf has a spin period of 206 seconds. The X-ray emission observed by RXTE is postulated to arise from two small regions on the surface of the white dwarf where the accreting matter strikes its surface--- analogous to the production of the Corona Borealis by the North and South magnetic poles on Earth. Within this theoretical framework, as the outburst began in XY Arietis the inner edge of the accretion disk moved closer to the white dwarf and obscured one of the magnetic poles, thereby increasing the amplitude of the white dwarf's spin pulsations as reflected in the modulation of the X-rays (see Figure 2). The investigators on this project were Drs. Coel Hellier and Andrew Beardmore at Keele University in England, and Dr. Koji Mukai at Goddard Space Flight Center in Maryland.
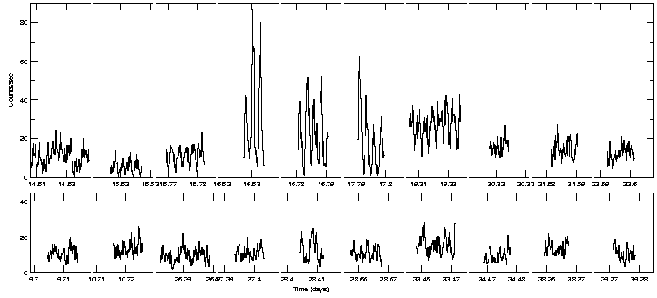
Figure 1: RXTE light curve of XY Arietis (2-10 keV). The x-axis shows the time in days, with gaps taken out. Initially the fractional pulse modulation is small, but around t=16.53 the flux increases dramatically, as does the degree of modulation. The bottom panel shows a continuation of the light curve after the outburst ended. Both the flux and the fractional pulse modulation have decreased.
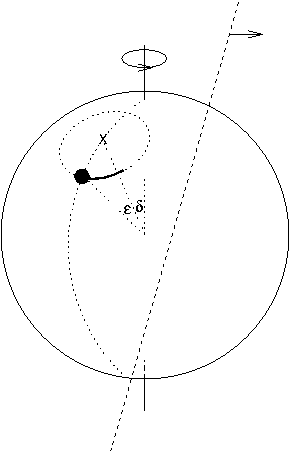
Figure 2: Schematic of the white dwarf in XY Ari. The spin axis is indicated by the vertical line extending through the star. The magnetic axis is offset about 20 degrees and is shown by the small X. The "hot spot" of accretion onto the star is shown by the heavy dot. Through timing analysis of the pulses, constraints are placed on the movement of the hot spot on the star.
Back to Snazzy Science If you have a question about RXTE, please send email to one of our help desks.
|


- RXTE Project Scientist: Tod Strohmayer
- NASA Official: Rob Petre
- Web Curator: J.D. Myers
- Last Modified: 24-Aug-2022