

Data Simulation and Analysis Threads
Examine PN Timing Data with Xronos
Xronos is software in the HEASARC's ftools that produce timing data products. Here, we give a short introduction on how to use some of the tasks.
The example data set is from an observation of EXO 2030+375, Obs ID 0745240201. The file pn_events.fits refers to the timing event file produced by epproc or epchain which has had the standard filters applied.
Before we start, it is worthwhile to take note of a few things. First, some tasks can take either the event file or a light curve as input. Second, while we make use of the prompts below, users can also put all the information on the command line all at once. Finally, if you are using data from up to 4 observations, they can all be used as input for Xronos tasks by way of an @ file, similar to IRAF. For example, if we wanted to use three files,
ls obs1_events.fits obs2_events.fits obs3_events.fits > my_events.listThen, when a task prompts for the input file, enter "@my_events.list".
Let's start by making a light curve.
   ftools
   lcurve
Xronos will prompt you for more information. Below are our specifications and a description of the information Xronos is asking for.
   1                   # number of time series to consider
   pn_events.fits      # input file
   -                   # the name of window file; use '-' for default window
   1                   # the size of the time bins
   indef               # the number of new bins/interval; use 'indef' for default
   pn_lc_bin1.fits     # the name of the output file; enter whitespace if you don't want a file
   y                   # view a plot the results?
   <enter>             # what device pgplot should use; press 'enter' for the xwindows default
Xronos will pop up a plot of the light curve and put us in iplot, which gives us the opportunity to change the appearance of the plot. For more information on iplot can be found here and here.
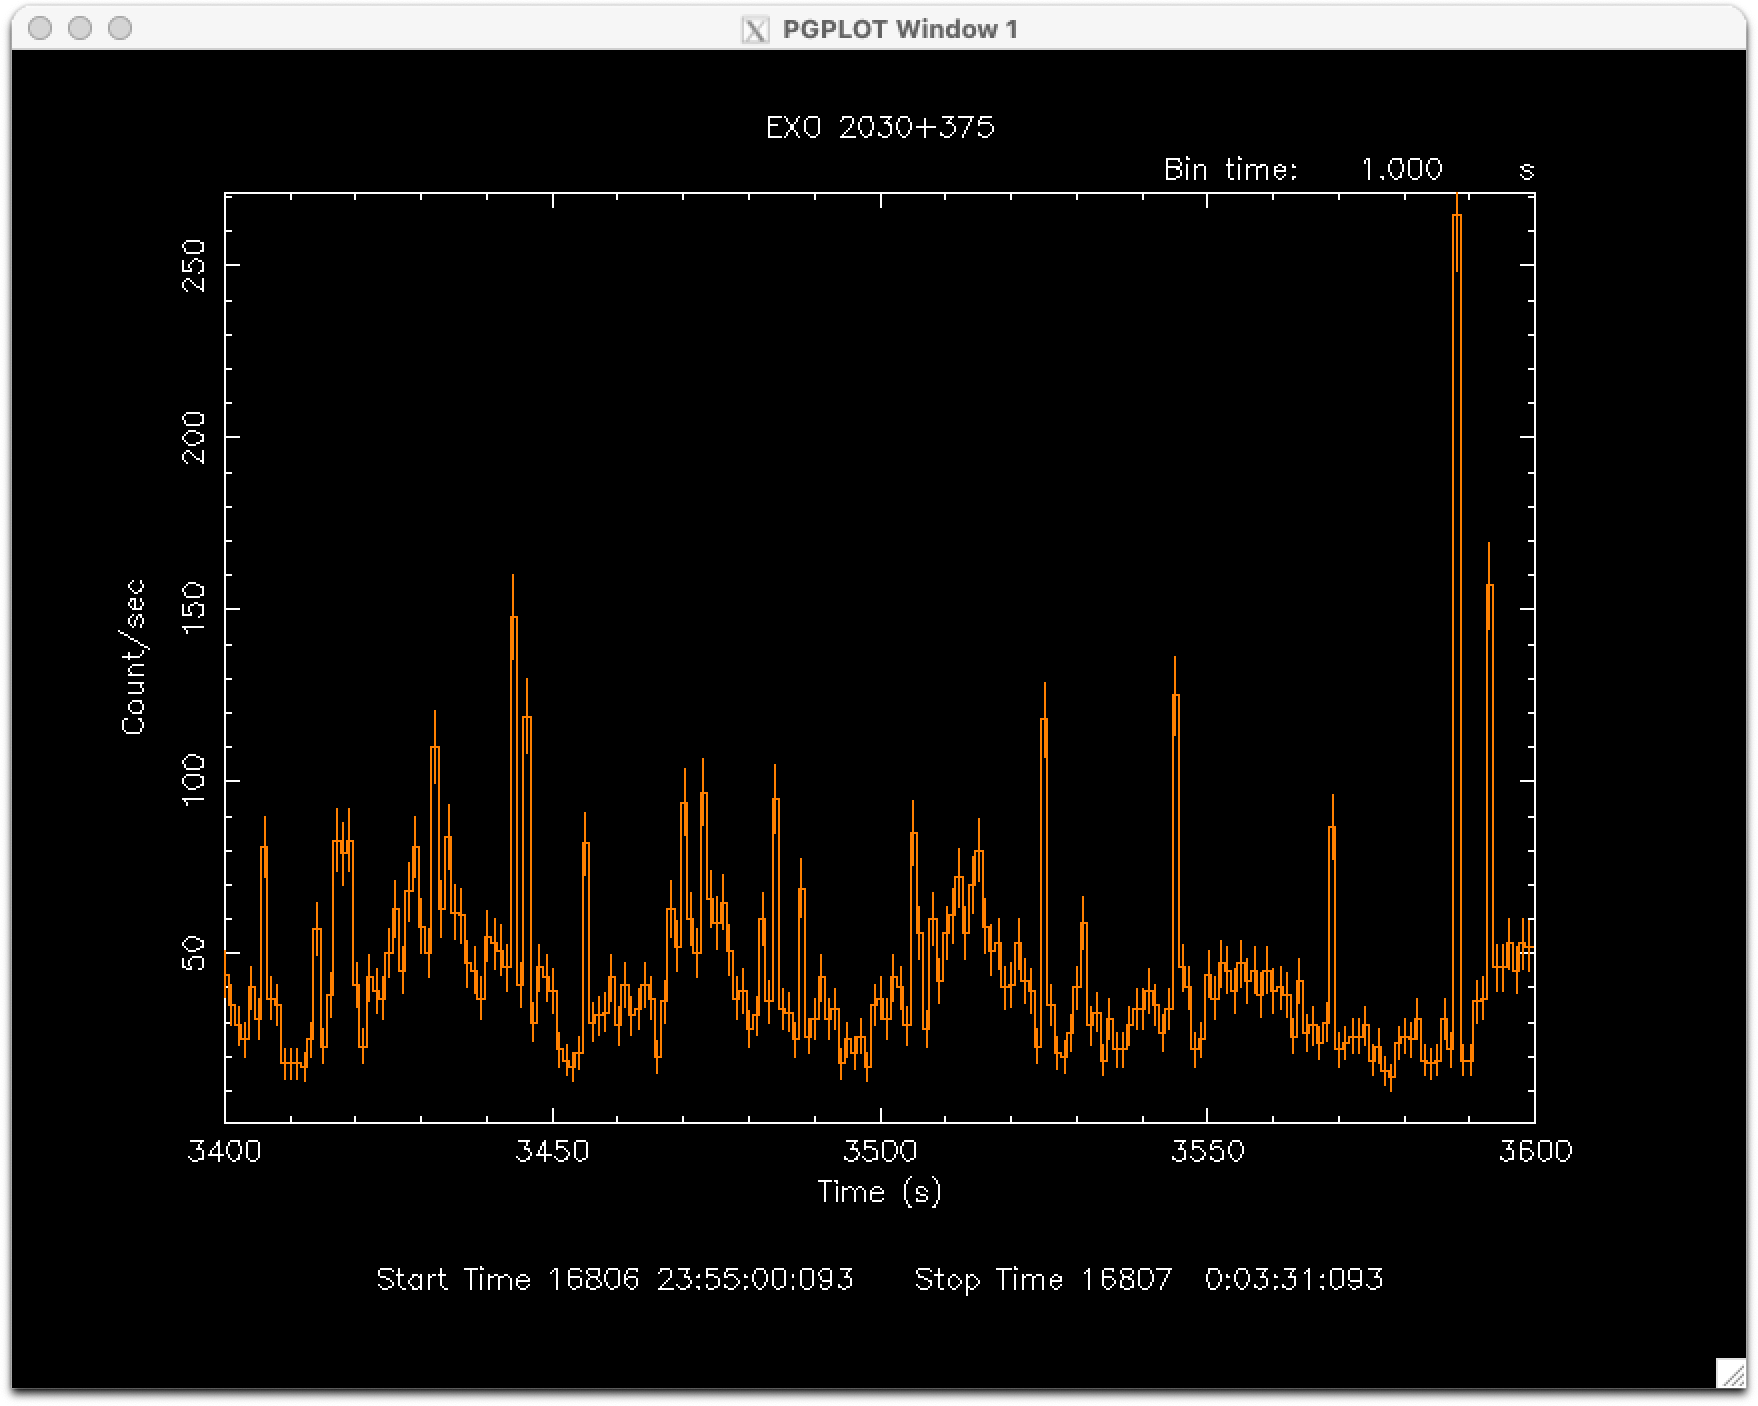
   line step           # use a step line to connect the data points
   color 8 on 2        # change the color of the y-vector (2) to color 8 (orange)
   redraw              # implement the above changes
   r x, 3400, 3600     # change the range on the X-axis to 3400-3600 seconds
   quit
   control-c           # we only want to see the first frame
For this dataset and our chosen new bin time of 1 second, the number of intervals was 61, so Xronos will try to show us each one by brining up a new frame after we quit out of one. We don't need to see all of them for this walk-through (though of course interested users should feel free to), so we contol-c'd out.
The light curve, with the alterations above, is shown in Figure 1.
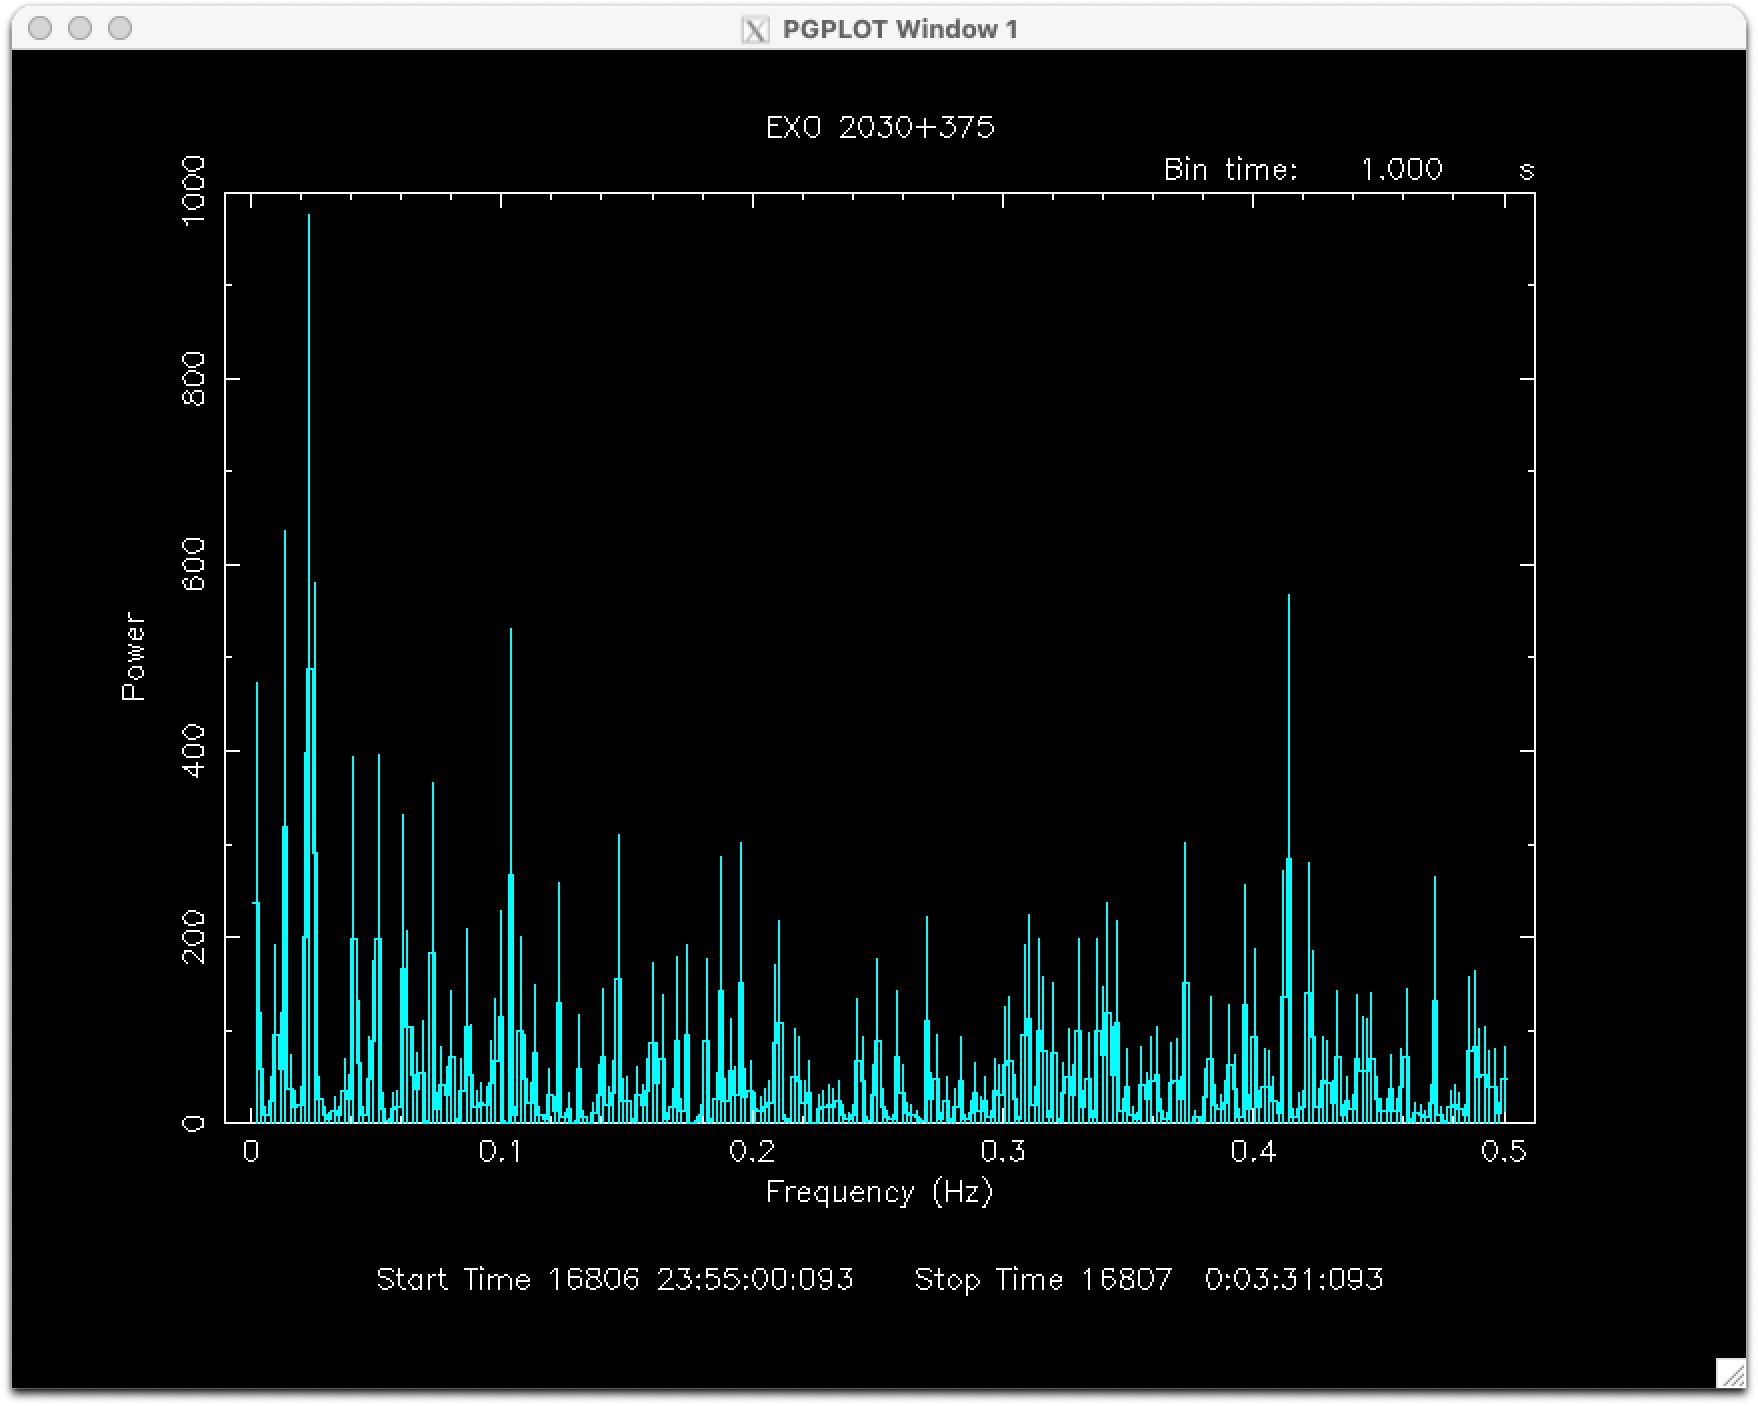
We can use the lcurve output file, pn_lc.fits, as input to powspec, which plots the power spectrum.
   powspec
   pn_lc_bin1.fits     # the light curve we just made
   -                   # name of window file, '-' for default window
   1                   # the new time bin size, if not using the same as for the light curve;
                       #    this can't be bigger than the light curve's binning
   indef               # number of new bins/interval; use 'indef' for default
   1                   # number of intervals/frame; set to 1 so you don't see every interval
   0
   pn_power.fits       # the name of the output file; enter whitespace if you don't want a file
   y                   # view a plot the results?
   <enter>             # what device pgplot should use; press 'enter' for the xwindows default
We again are in iplot, and tweak the plot a bit; see Figure 2:
   color 5 on 2        # use cyan for the data
   rescale y 0 1100    # change the range on the Y-axis
   quit
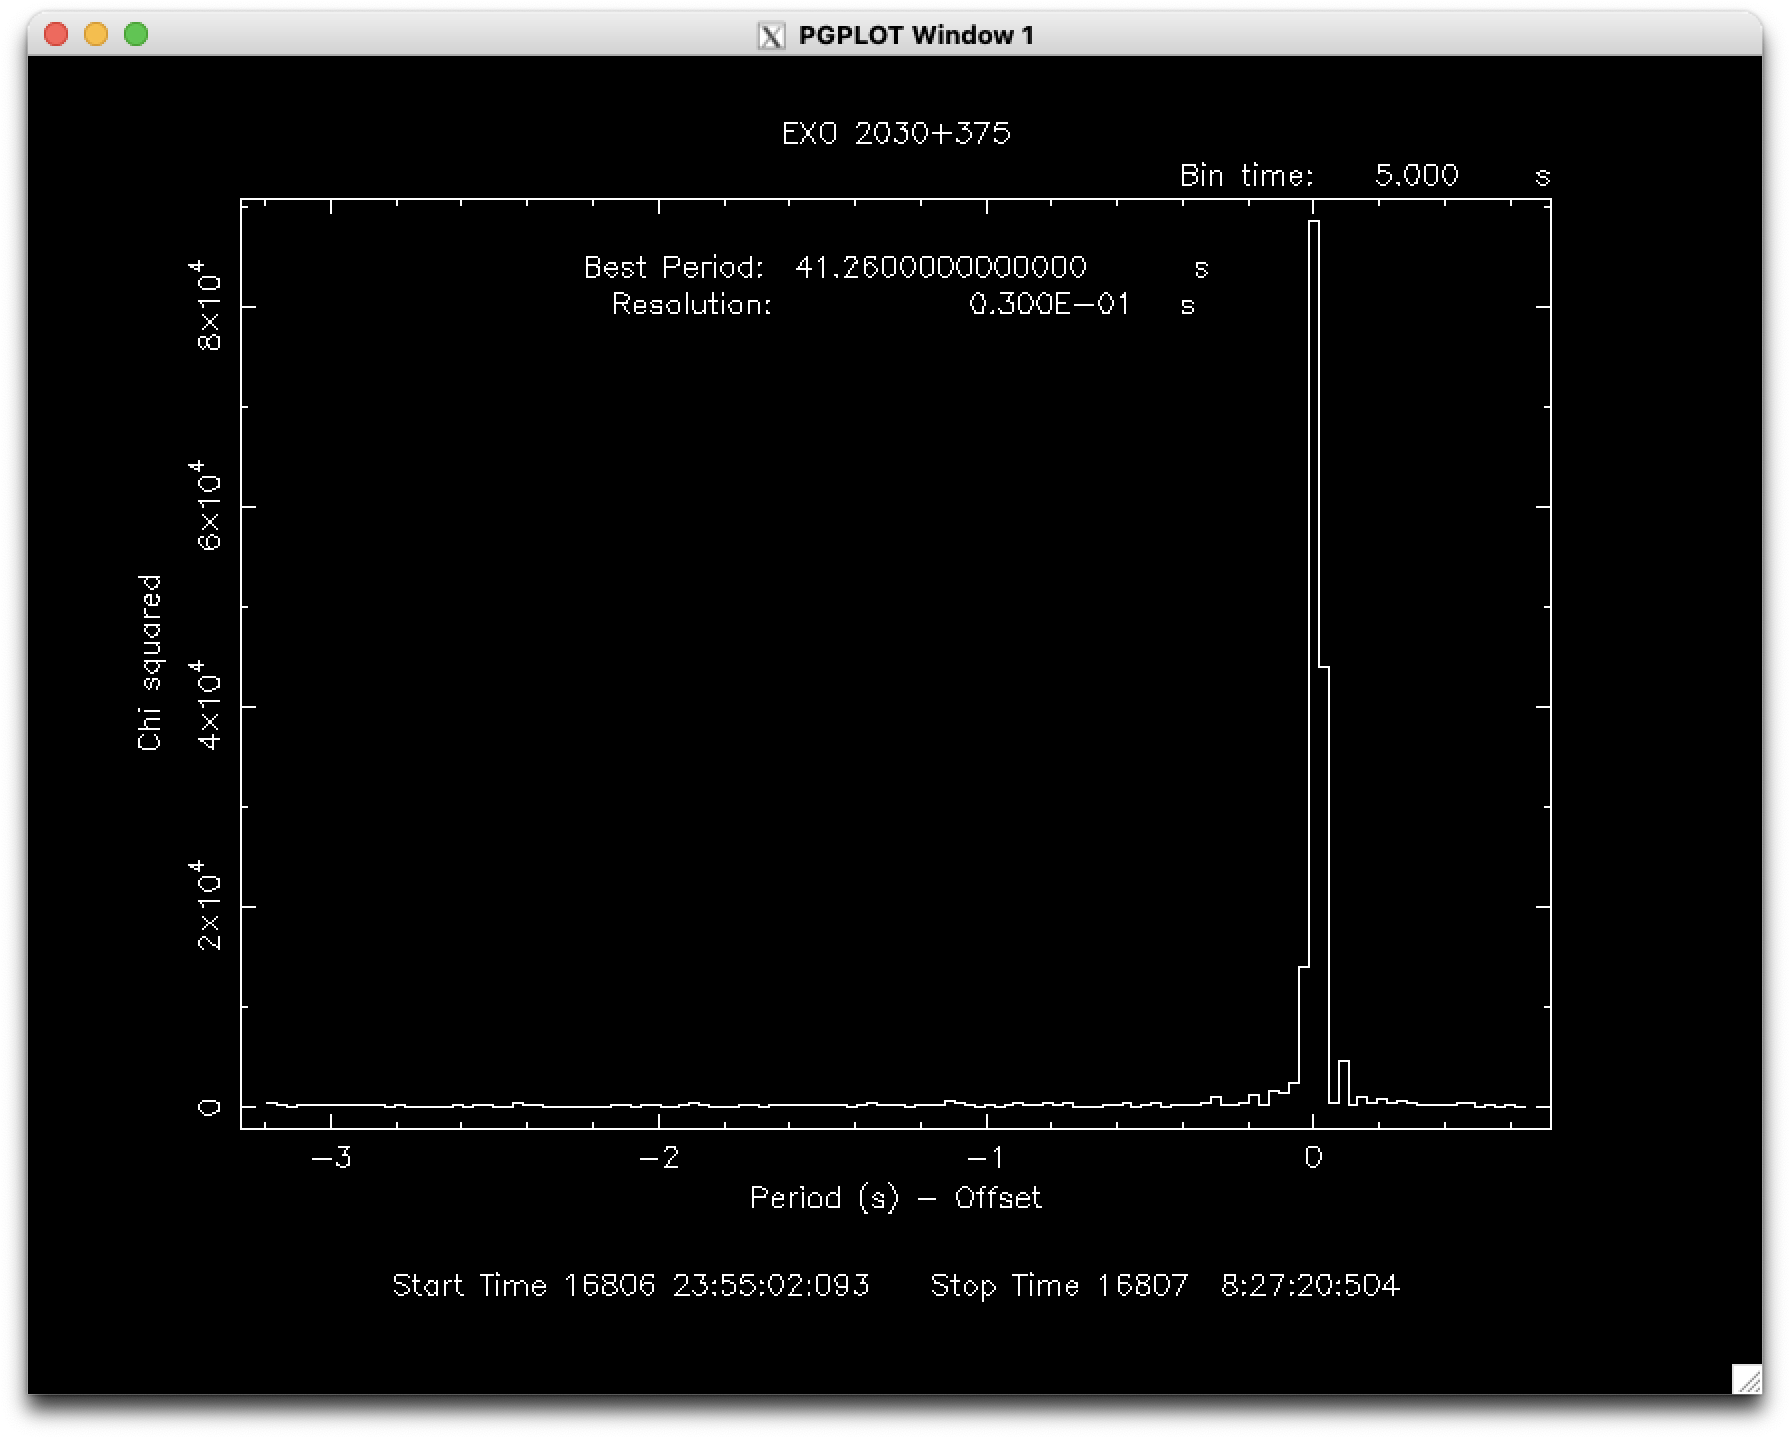
Next, we will find the periodicity with efsearch:
   efsearch
   pn_events.fits      # either the events file or the light curve can be used as input
   -                   # name of window file, '-' for default window
   indef               # the epoch in days; enter 'indef' for default
   40                  # period in seconds; eyeballing Figure 1, we can estimate that the period
                       #    is something around 40 seconds
   indef               # number of phasebins/period, enter 'indef' for default
   indef               # number of new bins/period, enter 'indef' for default
   0.03                # resolution for period search; using the PN's time resolution
   indef               # number of periods to search; enter 'indef' for default
   period_search.fits  # the name of the output file; enter whitespace if you don't want a file
   y                   # view a plot the results?
   <enter>             # what device pgplot should use; press 'enter' for the xwindows default
The result is in Figure 3.
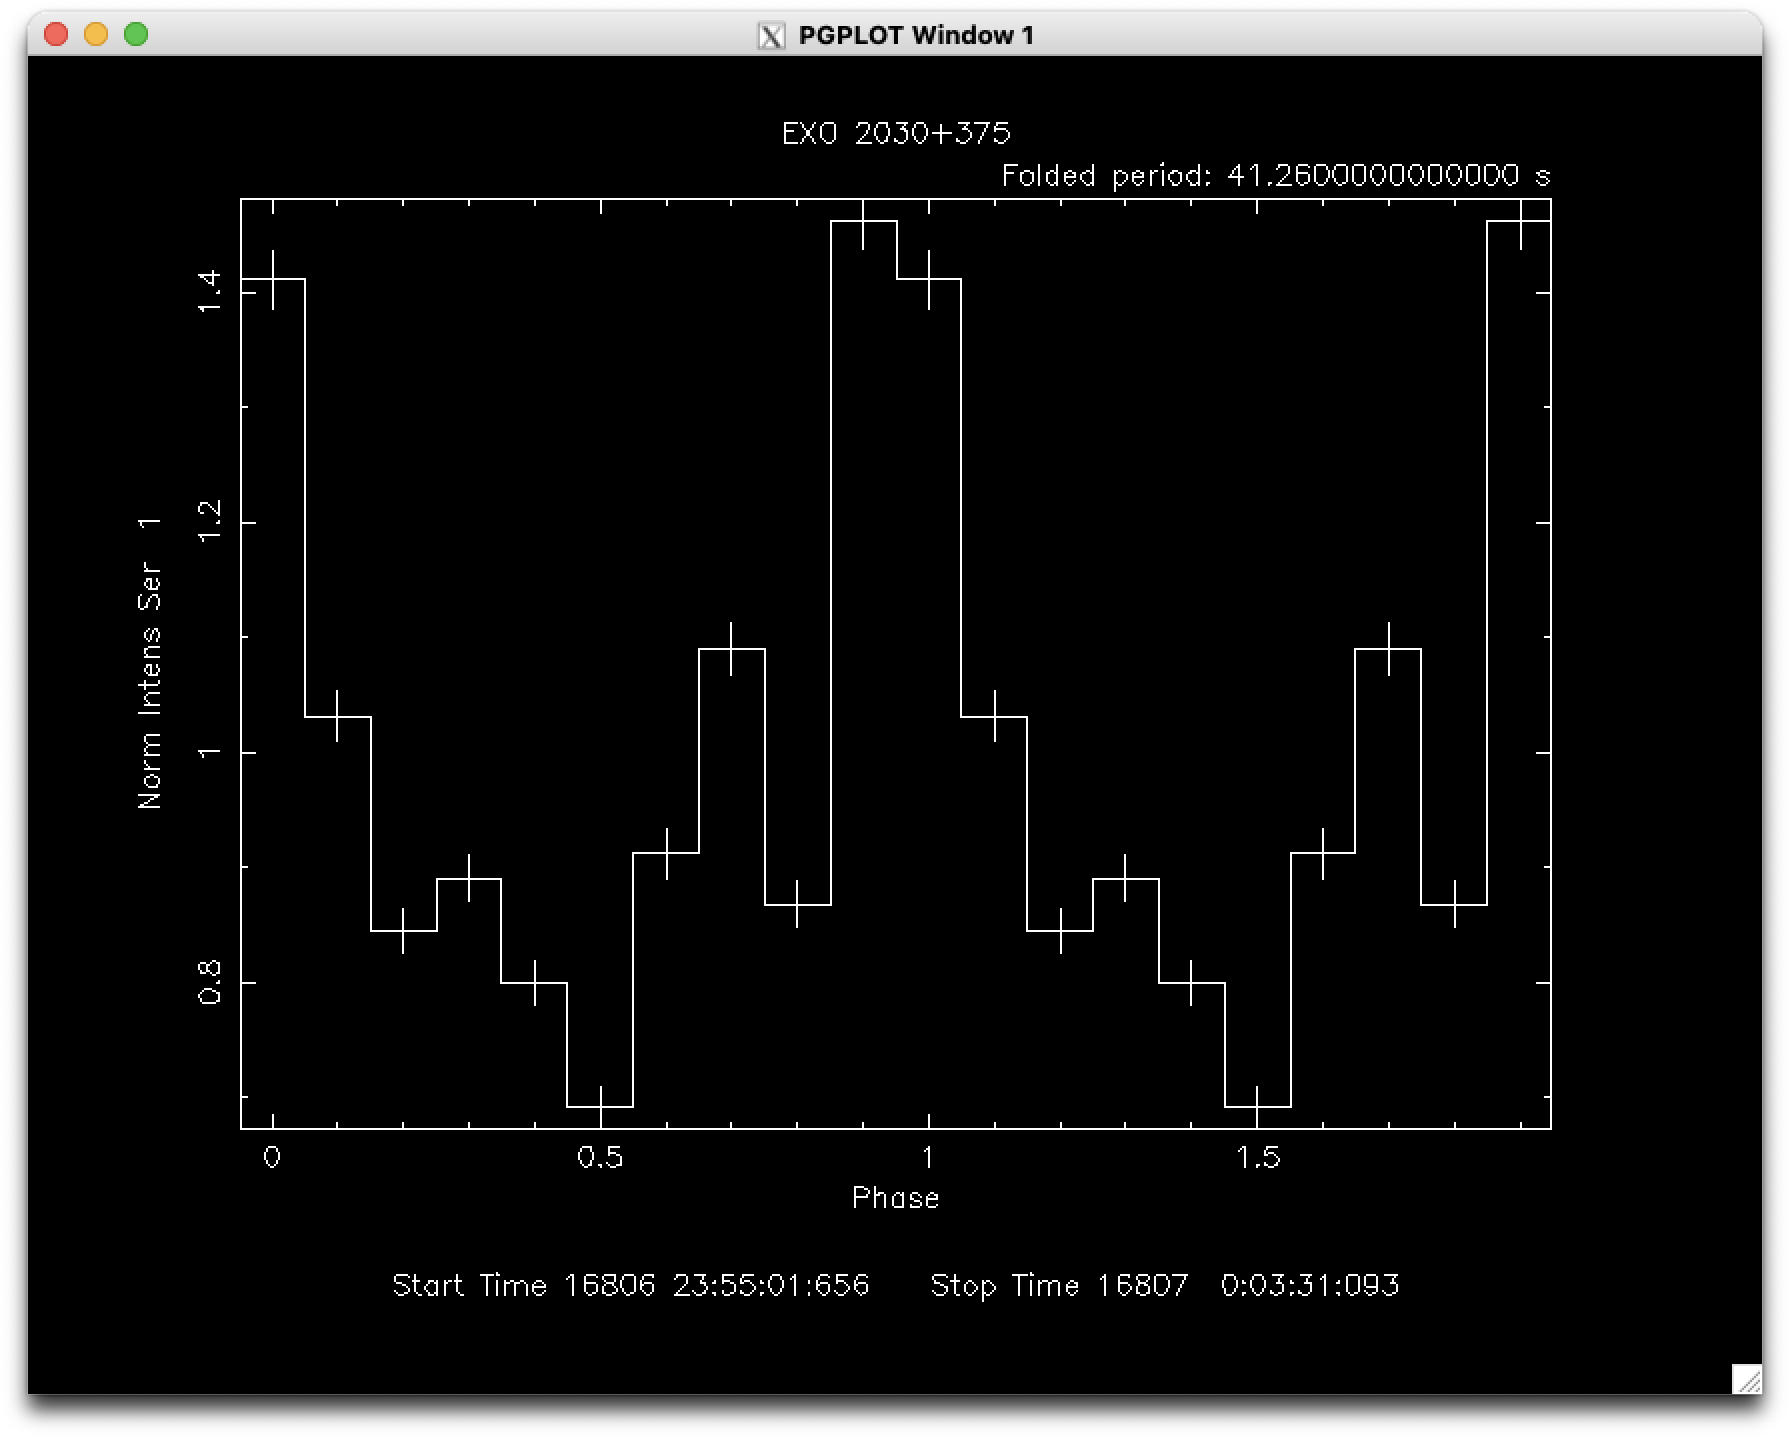
Lastly, we will make a folded light curve with efold using the output of lcurve and knowing now the period from efsearch.
   efold
   1                   # number of time series to consider
   pn_lc_bin1.fits     # name of the light curve file
   -                   # name of window file, '-' for default window
   indef               # the epoch in days; enter 'indef' for default
   41.26               # the period from efsearch
   indef               # number of phasebins/period, enter 'indef' for default
   indef               # number of new bins/period, enter 'indef' for default
   1                   # number intervals/frame; enter '1' to see only the first frame
   pn_lc_folded.fits   # the name of the output file; enter whitespace if you don't want a file
   y                   # view a plot the results?
   <enter>             # what device pgplot should use; press 'enter' for the xwindows default
We again are put into iplot, and we tweak it lightly.
   line step           # add a step line to the plot
   redraw              # draw the plot with the modifications
   quit
The result is in Figure 4.
More information about Xronos, including a manual with examples and help with plotting, can be found here.
If you have any questions concerning XMM-Newton send e-mail to xmmhelp@lists.nasa.gov