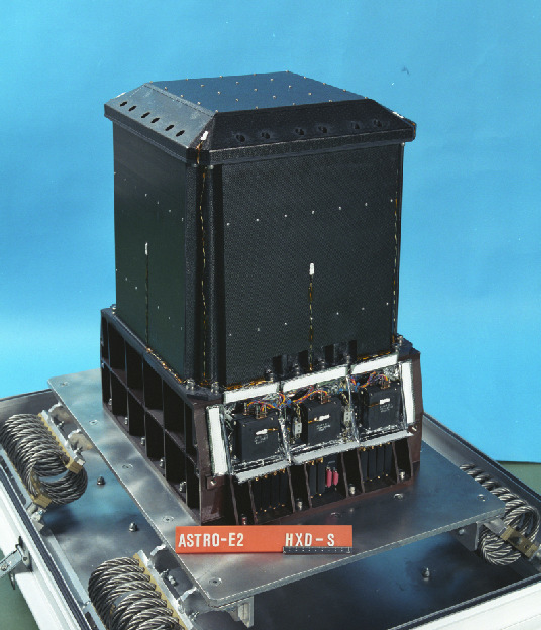
The Hard X-ray Detector (HXD, see Figure 8.1) is a
non-imaging, collimated hard X-ray scintillating instrument sensitive
in the ![]() keV to
keV to ![]() keV band. It has been developed
jointly by the University of Tokyo, Aoyama Gakuin University,
Hiroshima University, ISAS/JAXA, Kanazawa University, Osaka
University, Saitama University, SLAC, and RIKEN. Its main purpose is
to extend the bandpass of the Suzaku observatory to the highest feasible
energies, thus allowing broad-band studies of celestial objects.
keV band. It has been developed
jointly by the University of Tokyo, Aoyama Gakuin University,
Hiroshima University, ISAS/JAXA, Kanazawa University, Osaka
University, Saitama University, SLAC, and RIKEN. Its main purpose is
to extend the bandpass of the Suzaku observatory to the highest feasible
energies, thus allowing broad-band studies of celestial objects.
This AO-7 document is based on the calibration of the PIN and the GSO detectors as of October 2010 (HEASOFT 6.9). The recommended procedure for feasibility simulations is basically unchanged from previuos AOs, the same response and background files as provided for AO-6 can be used for simulations. Note that the HXD aim point is not supported anymore (see chapter 2 and section 5.5.2).
|
The HXD sensor (HXD-S) is a compound-eye detector instrument,
consisting of 16 main detectors (arranged as a 4 ![]() 4 array) and
the surrounding 20 crystal scintillators for active shielding. Each
unit actually consists of two types of detectors: a GSO/BGO phoswich
counter, and 2mm-thick PIN silicon diodes located inside the well,
but in front of the GSO scintillator. The PIN diodes are mainly
sensitive below
4 array) and
the surrounding 20 crystal scintillators for active shielding. Each
unit actually consists of two types of detectors: a GSO/BGO phoswich
counter, and 2mm-thick PIN silicon diodes located inside the well,
but in front of the GSO scintillator. The PIN diodes are mainly
sensitive below ![]() keV, while the GSO/BGO phoswich counter
(scintillator) is sensitive above
keV, while the GSO/BGO phoswich counter
(scintillator) is sensitive above ![]() keV. The scintillator
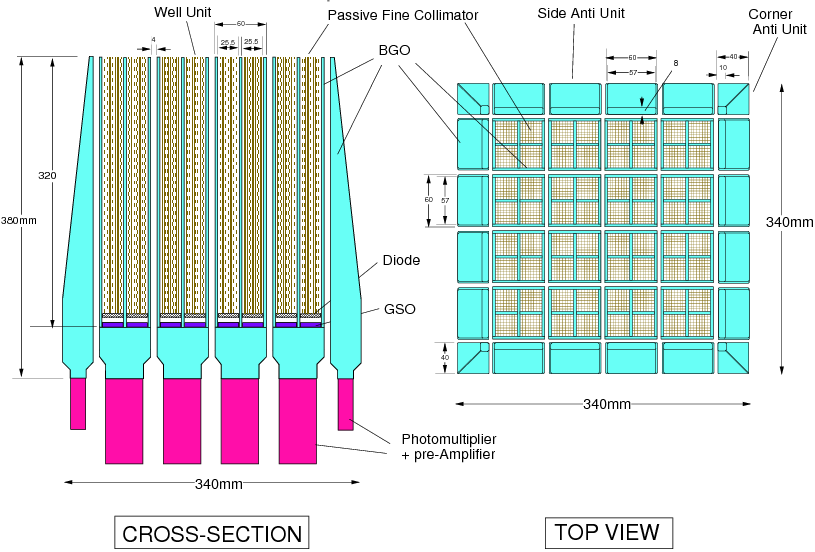
signals are read out by photomultiplier tubes (PMTs). A schematic
drawing of the HXD is given in Fig. 8.2. The HXD features
an effective area of
keV. The scintillator
signals are read out by photomultiplier tubes (PMTs). A schematic
drawing of the HXD is given in Fig. 8.2. The HXD features
an effective area of ![]() cm
cm![]() at 20keV, and
at 20keV, and ![]() cm
cm![]() at 100keV (Fig. 3.5). The energy
resolution
at 100keV (Fig. 3.5). The energy
resolution ![]() 4.5keV (FWHM) for the PIN diodes, and
4.5keV (FWHM) for the PIN diodes, and
![]() % (FWHM) for the scintillators, where
% (FWHM) for the scintillators, where ![]() is energy in MeV.
The HXD time resolution is 61
is energy in MeV.
The HXD time resolution is 61![]() s.
s.
Each main detector unit is of a well-type design with active
anti-coincidence shields. The shields and the coarse collimator itself
are made of Bismuth Germanate (BGO, Bi![]() Ge
Ge![]() O
O![]() )
crystals, while the X-ray sensing material ``inside the well''
consists of Gadolinium Silicate (GSO, Gd
)
crystals, while the X-ray sensing material ``inside the well''
consists of Gadolinium Silicate (GSO, Gd![]() SiO
SiO![]() (Ce))
crystals. The aspect ratio of the coarse collimators yields an
acceptance angle for the GSO of 4.5
(Ce))
crystals. The aspect ratio of the coarse collimators yields an
acceptance angle for the GSO of 4.5![]() (FWHM). Each unit forms
a 2
(FWHM). Each unit forms
a 2 ![]() 2 matrix, containing four 24mm
2 matrix, containing four 24mm ![]() 24mm, 5mm
thick GSO crystals, each placed behind a PIN diode. BGO crystals are
also placed underneath of the GSO sensors, and thus each well is a
five-sided anti-coincidence system. The effective thickness of the BGO
active shield is about 6cm for any direction from the PIN and GSO,
except for the pointing direction.
24mm, 5mm
thick GSO crystals, each placed behind a PIN diode. BGO crystals are
also placed underneath of the GSO sensors, and thus each well is a
five-sided anti-coincidence system. The effective thickness of the BGO
active shield is about 6cm for any direction from the PIN and GSO,
except for the pointing direction.
The reason for the choice of the two different crystals for the sensor
and the shield is dictated by the large stopping ability of both, yet
the very different rise/decay times, of ![]() ns for BGO, and
ns for BGO, and
![]() ns for GSO, at a working temperature of
ns for GSO, at a working temperature of ![]() C.
This allows for an easy discrimination of the shield vs. X-ray sensor
signals, where a single PMT can discriminate between the two types of
scintillators in which an event may have occurred. Any particle events
or Compton events that are registered by both the BGO and GSO can be
rejected by this phoswich technique, utilizing custom-made
pulse-shaping LSI circuits.
C.
This allows for an easy discrimination of the shield vs. X-ray sensor
signals, where a single PMT can discriminate between the two types of
scintillators in which an event may have occurred. Any particle events
or Compton events that are registered by both the BGO and GSO can be
rejected by this phoswich technique, utilizing custom-made
pulse-shaping LSI circuits.
In early 2010, a new GSO gain calibration with associated response files has been released. With this update, GSO data become usable down to 50keV. See the Suzaku web pages for more details 8.1. Note that proposers do not need to consider the details of the new responses, since the differences to the old ones are minor with respect to performing feasibility simulations (although not negligible in a real data analysis).
The low energy response of the HXD is provided by 2mm thick PIN
silicon diodes, placed in front of each GSO crystal. The geometrical
area of the diodes is 21.5 ![]() 21.5mm
21.5mm![]() , while the effective
area is limited to
, while the effective
area is limited to ![]() 16.5
16.5 ![]() 16.5mm
16.5mm![]() by the guard ring
structure. The temperature of the PIN diodes is controlled to be
by the guard ring
structure. The temperature of the PIN diodes is controlled to be ![]()
![]() C to suppress electrical noise caused by the leakage
current, and they are almost fully depleted by applying a bias voltage
of 400
C to suppress electrical noise caused by the leakage
current, and they are almost fully depleted by applying a bias voltage
of 400![]() 500V
8.2. The
PIN diodes absorb X-rays with energies below
500V
8.2. The
PIN diodes absorb X-rays with energies below ![]() keV, but
gradually become transparent at harder X-rays, which reach and are
registered by the GSO detectors. The X-rays are photoelectrically
absorbed in the PIN diodes, and the signal is amplified, converted to
digital form, and read out by the associated electronics. The PIN
diodes are of course also actively shielded from particle events by
the BGO shields, as they are placed inside the deep BGO wells. In
addition, in order to reduce contamination by the cosmic X-ray
background, passive shields called ``fine collimators'' are inserted
in the well-type BGO collimator above the PIN diodes. The fine
collimator is made of 50
keV, but
gradually become transparent at harder X-rays, which reach and are
registered by the GSO detectors. The X-rays are photoelectrically
absorbed in the PIN diodes, and the signal is amplified, converted to
digital form, and read out by the associated electronics. The PIN
diodes are of course also actively shielded from particle events by
the BGO shields, as they are placed inside the deep BGO wells. In
addition, in order to reduce contamination by the cosmic X-ray
background, passive shields called ``fine collimators'' are inserted
in the well-type BGO collimator above the PIN diodes. The fine
collimator is made of 50![]() m thick phosphor bronze sheets,
arranged to form 8
m thick phosphor bronze sheets,
arranged to form 8 ![]() 8 square meshes, 3mm wide and 300mm
long, each.
8 square meshes, 3mm wide and 300mm
long, each.
The lower threshold of the PIN diodes has gradually become higher due to the increase of leakage current by cosmic-ray damage. Updated response files are regularly provided by the HXD team, for well defined ``epochs'' in time. As of August 2011 calibration epoch 11 is the newest/current one.
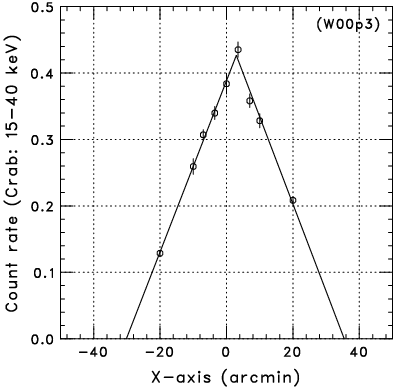
The field of view of the HXD changes with incoming energy. Below ![]() keV the passive fine collimators define a
keV the passive fine collimators define a
![]() FWHM
square opening as shown in Figure 8.3. The narrow
field of view compared to the Beppo-SAX-PDS and
RXTE-HEXTE experiments is one of the key advantages of HXD
observations. Above
FWHM
square opening as shown in Figure 8.3. The narrow
field of view compared to the Beppo-SAX-PDS and
RXTE-HEXTE experiments is one of the key advantages of HXD
observations. Above ![]() keV the fine collimators become
transparent and the BGO active collimator defines a 4.5
keV the fine collimators become
transparent and the BGO active collimator defines a 4.5
![]() 4.5
4.5 ![]() FWHM square opening. In summary, the full
PIN energy range and the lower quarter of the GSO range have a field
of view of
FWHM square opening. In summary, the full
PIN energy range and the lower quarter of the GSO range have a field
of view of ![]() , while the GSO events above
, while the GSO events above ![]() keV have a
wider field of view, up to 4.5
keV have a
wider field of view, up to 4.5![]() .
.
|
Although the HXD is a non-imaging instrument, its instantaneous
background can be reproduced through modeling, without requiring
separate off-source observations. The HXD has been designed to achieve
an extremely low in-orbit background (![]() cps cm
cps cm![]() keV
keV![]() ), based on a combination of novel
techniques: (1) the five-sided tight BGO shielding as mentioned above,
(2) the use of the 20 shielding counters made of thick BGO crystals
which surround the 16 main GSO/BGO counters, (3) sophisticated on-board
signal processing and on-board event selection, employing both
high-speed parallel hardware circuits in the analog electronics, and
CPU-based signal handling in the digital electronics, and (4) the
careful choice of materials that do not become strongly activated
under in-orbit particle bombardment. Finally, (5) the narrow field of
view below
), based on a combination of novel
techniques: (1) the five-sided tight BGO shielding as mentioned above,
(2) the use of the 20 shielding counters made of thick BGO crystals
which surround the 16 main GSO/BGO counters, (3) sophisticated on-board
signal processing and on-board event selection, employing both
high-speed parallel hardware circuits in the analog electronics, and
CPU-based signal handling in the digital electronics, and (4) the
careful choice of materials that do not become strongly activated
under in-orbit particle bombardment. Finally, (5) the narrow field of
view below ![]() keV defined by the fine collimator effectively
reduces both the CXB contribution and the source confusion.
keV defined by the fine collimator effectively
reduces both the CXB contribution and the source confusion.
|
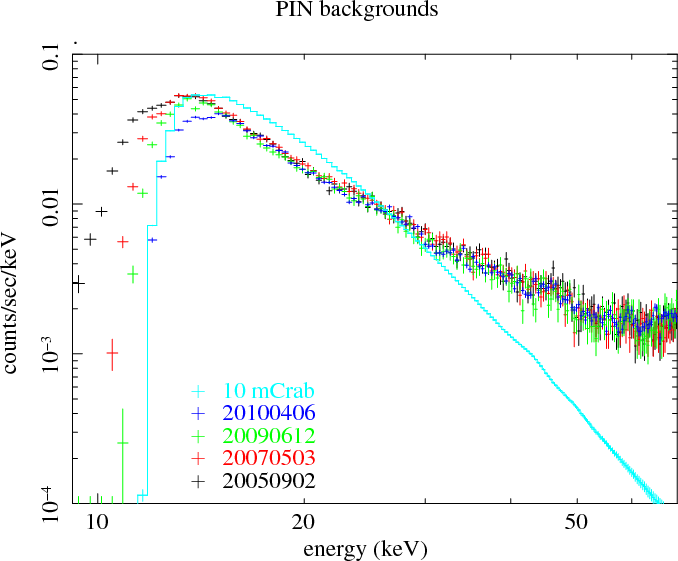
The non X-ray background (NXB) of the PIN diodes, measured in orbit,
is plotted in the left panel of Fig. 8.4. The average
background count rate summed over the 64 PIN diodes is
![]() 0.6counts s
0.6counts s![]() , which is roughly equal to an intensity of
10mCrab. In addition, almost no long-term growth has been observed
in the PIN-NXB during the first three years of Suzaku, thanks to the
small activation effect of silicon. In contrast, as shown in the right
panel of Fig. 8.4, a significant long-term increase
caused by in-orbit activation has been observed for the GSO-NXB,
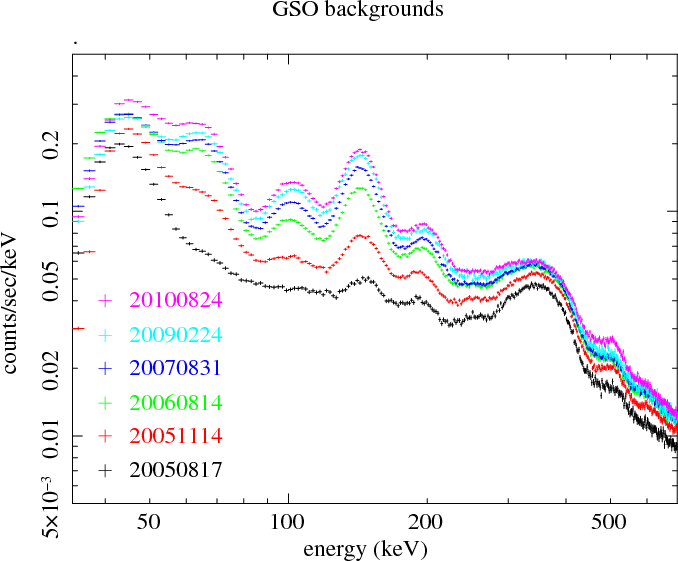
especially during the early phase of the mission. The background
spectrum of the GSO contains several activation peaks, with
intensities exponentially increasing with their half-lives. Since the
longest half-life is about one year, the GSO-NXB level will have
almost saturated.
, which is roughly equal to an intensity of
10mCrab. In addition, almost no long-term growth has been observed
in the PIN-NXB during the first three years of Suzaku, thanks to the
small activation effect of silicon. In contrast, as shown in the right
panel of Fig. 8.4, a significant long-term increase
caused by in-orbit activation has been observed for the GSO-NXB,
especially during the early phase of the mission. The background
spectrum of the GSO contains several activation peaks, with
intensities exponentially increasing with their half-lives. Since the
longest half-life is about one year, the GSO-NXB level will have
almost saturated.
|
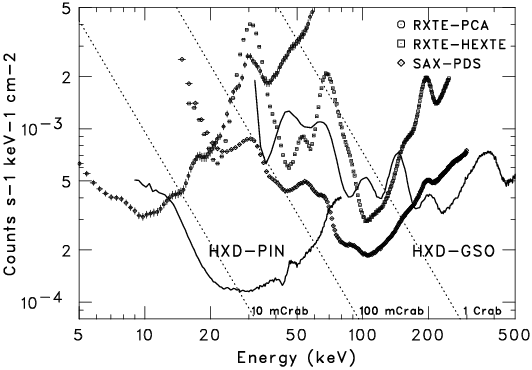
Figure 8.5 illustrates the comparison between detector backgrounds of several hard X-ray missions. The lowest background level per effective area is achieved by the HXD in an energy range of 12-70 and 150-500keV. The in-orbit sensitivity of the experiment can be roughly estimated by comparing the background level with celestial source intensities indicated by dotted lines. Below 30keV, the level is smaller than 10mCrab, which means a sensitivity better than 0.3mCrab can be obtained, if an accuracy of 3% is achieved in the background modeling.
|
Since the long-term variation of both PIN-NXB and GSO-NXB can be
expected to be stable, the main uncertainties of the background come
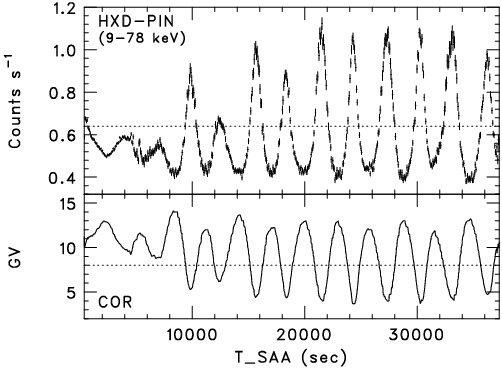
from temporal and spectral short-term variations. As shown in
Fig. 8.6, the PIN-NXB displays significant
short-term variability, with a peak-to-peak amplitude of a factor of
3, anti-correlated with the Cut-Off Rigidity (COR) over the
orbit. Since the COR affects the flux of incoming primary cosmic-ray
particles, most of the PIN-NXB is considered to originate in the
secondary emission produced by interactions between cosmic-ray
particles and materials surrounding the detector. When a selection
criterion of COR![]() 6, a standard value used in the pipeline
processing, is applied for the event extraction, the amplitude
decreases to a factor of
6, a standard value used in the pipeline
processing, is applied for the event extraction, the amplitude
decreases to a factor of ![]() 2. During this temporal variation of
the PIN-NXB, its spectral shape also changes slightly (larger
deviations from the average are observed at a higher energy range,
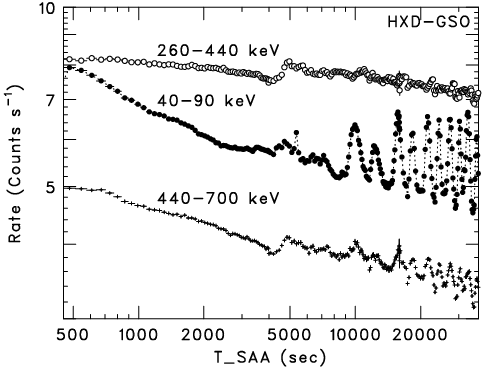
Kokubun et al. 2007). In case of the GSO-NXB the temporal variation
differs for different energy bands, as shown in the right panel of
Fig 8.6. In the lowest energy range a rapid decline
after the SAA passage is clearly observed, in addition to a similar
anti-correlation with the COR. All these temporal and spectral
behaviors have to be properly handled in the background modeling.
2. During this temporal variation of
the PIN-NXB, its spectral shape also changes slightly (larger
deviations from the average are observed at a higher energy range,
Kokubun et al. 2007). In case of the GSO-NXB the temporal variation
differs for different energy bands, as shown in the right panel of
Fig 8.6. In the lowest energy range a rapid decline
after the SAA passage is clearly observed, in addition to a similar
anti-correlation with the COR. All these temporal and spectral
behaviors have to be properly handled in the background modeling.
As is the case for every non-imaging instrument (and in particular, for those sensitive in the hard X-ray range), the limiting factor for the sensitivity of the HXD is the reproducibility of the background estimation. Since this is the first space flight of an HXD-type detector, and the reproduction of the in-orbit background is not at all an easy task, the modeling accuracy evolves with the experience with in-orbit data. The latest status of the estimation procedures and their uncertainties will be regularly posted on the Suzaku web-sites listed in Appendix B. For proposal preparation, methods, limitations, and reproducibilities (as a function of time-scale and energy range) of the current background modeling are briefly described below. Note that this document is based on ``Suzaku-memo-2008-03'' (Mizuno et al. 2008) and ``Suzaku-memo-2008-01'' (Fukazawa et. al 2008), which can be found at http://www.astro.isas.jaxa.jp/suzaku/doc/suzakumemo, and on Fukazawa et. al (2010, PASJ 61, S17). We recommend that proposers properly take into account the expected uncertainties for their observation, based on the following information. Note that all uncertainties are reported at the 90% confidence level in this section.
Since there is a strong anti-correlation between the PIN-NXB and the COR, the background modeling of the PIN is primarily based on the count rate of high-energy charged particles, directly measured by the PIN diodes. Due to large energy deposits in the silicon, penetrations of cosmic-ray particles cause large signals in the corresponding PIN diodes. Hence they activate the Upper Discriminator (UD) in the analog electronics and are then recorded as PIN-UD monitor count in the HK data. The PIN-UD rate is considered to directly indicate the flux of primary cosmic-ray particles. The background count rate at any time can be generally estimated based on the corresponding PIN-UD rate.
In the actual modeling procedure of the so called ``tuned-bgd'', the PIN-NXB rate is described by adding the raw PIN-UD rate and the integrated PIN-UD rate with a fixed decay time constant, to take into account the small effect of activation during SAA passages. In addition, several parameters such as GSO count rate, Earth elevation angle and cut-off rigidity, are included as input parameters.
The spectral shape of the PIN-NXB is assumed to depend on the COR and the elapsed time after the SAA passage. For each estimated rate it is extracted from a database of PIN-NXB spectra, which has been compiled from Earth occultation data.
|
|
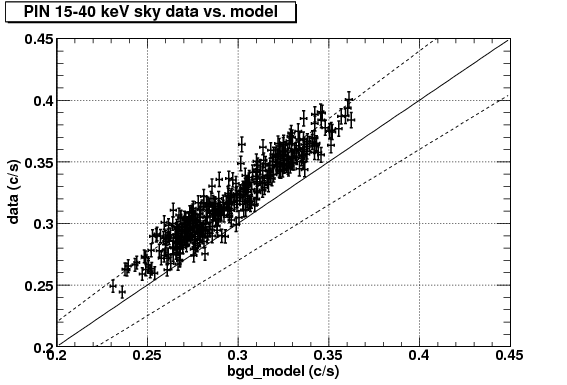
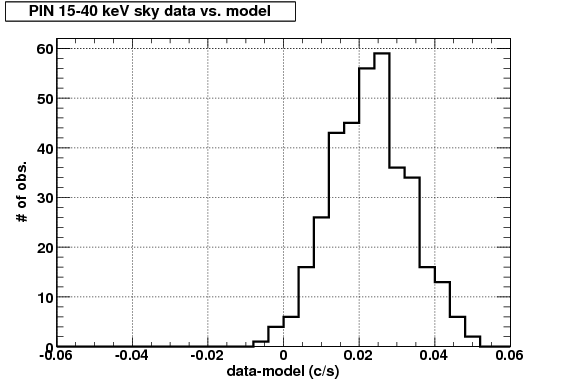
We first selected observations with no strong X-ray emission above
7keV (less than 20% above the XIS-FI NXB in the entire XIS
field-of-view) and compared the HXD-PIN data and the NXB model count
rate (10ks exposure) in the 15-40keV band, as shown in
Figure 8.7. The 90% confidence region (including a
statistical uncertainty of ![]() %) of the residual is 5.8% of
the mean NXB count rate, which is larger than that obtained from the
Earth occultation data (
%) of the residual is 5.8% of
the mean NXB count rate, which is larger than that obtained from the
Earth occultation data (![]() % including 3.1% statistical
uncertainty, see § 3.2 of ``Suzaku-memo-2008-03'').
% including 3.1% statistical
uncertainty, see § 3.2 of ``Suzaku-memo-2008-03'').
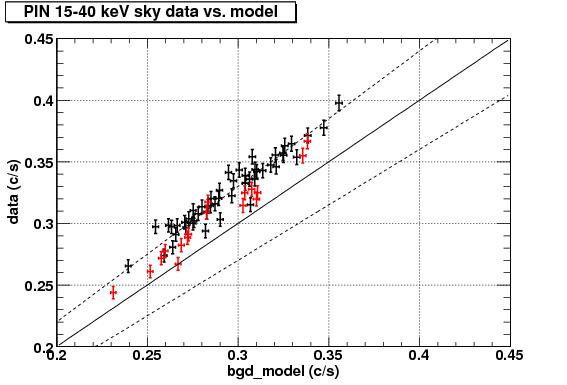
Figure 8.8 shows the same comparison of
sky data and the NXB model for E0102![]() 72 observations (the same sky
region is observed regularly for XIS calibration purposes). Some
observations do not satisfy the selection criteria using XIS due to
sources or diffuse emission in the XIS field-of-view, but we used all
E0102
72 observations (the same sky
region is observed regularly for XIS calibration purposes). Some
observations do not satisfy the selection criteria using XIS due to
sources or diffuse emission in the XIS field-of-view, but we used all
E0102![]() 72 observations in order to compare sky data and the NXB model
for as big a data set as possible. We also plot the data and the NXB
model for Cygnus LOOP multi-pointing observations (regions within a
radius of 1.5degrees were observed). We see a clear difference of
the residual between the two sets of observations. Especially, the
width of the residual for the E0102
72 observations in order to compare sky data and the NXB model
for as big a data set as possible. We also plot the data and the NXB
model for Cygnus LOOP multi-pointing observations (regions within a
radius of 1.5degrees were observed). We see a clear difference of
the residual between the two sets of observations. Especially, the
width of the residual for the E0102![]() 72 data is much narrower than
that seen in Fig. 8.7.
72 data is much narrower than
that seen in Fig. 8.7.
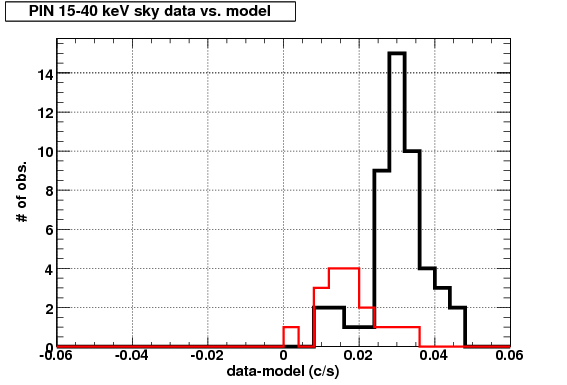
The 90% confidence region of the residual obtained from the
E0102![]() 72 observations is
72 observations is
![]() counts s
counts s![]() , or
, or ![]() of the mean NXB rate, including the statistical uncertainty
of
of the mean NXB rate, including the statistical uncertainty
of ![]() %. This is somewhat larger, but comparable to, the
residual distribution of 3.8% (including the statistical uncertainty
of 3.1%) obtained from Earth occultation data. After subtracting the
statistical uncertainty, the residual systematic uncertainty of the
E0102
%. This is somewhat larger, but comparable to, the
residual distribution of 3.8% (including the statistical uncertainty
of 3.1%) obtained from Earth occultation data. After subtracting the
statistical uncertainty, the residual systematic uncertainty of the
E0102![]() 72 observations is estimated to be 3.8%, for a typical 10ks
exposure. As described above, the E0102
72 observations is estimated to be 3.8%, for a typical 10ks
exposure. As described above, the E0102![]() 72 data might suffer from
contamination from sources within the field-of-view, and thus this
confidence region should be regarded as a conservative estimate. For
longer exposures the systematic uncertainty is expected to become a
bit smaller, though the lack of long-exposure sample observations
makes it difficult to verify this effect at the moment.
72 data might suffer from
contamination from sources within the field-of-view, and thus this
confidence region should be regarded as a conservative estimate. For
longer exposures the systematic uncertainty is expected to become a
bit smaller, though the lack of long-exposure sample observations
makes it difficult to verify this effect at the moment.
In order to check the NXB reproducibility for a sample of observations, we also investigated the background subtraction for eight objects for which the source signal is expected to be negligible in the HXD-PIN. The spectra are summarized in Figure 8.9. The background-subtracted spectra and the CXB model of Boldt (1987) 8.3 are displayed as blue and green histograms, respectively. No systematic difference between them is seen up to 60keV.
From these arguments, it is clear that the current NXB model reproducibility at the 90% confidence level (excluding the statistical error) is better than 5%, and will be as good as 3% in most observations with exposures longer than 10ks. When analyzing HXD data, the user should carefully estimate the reproducibility depending on the given observational conditions. For simplicity, we suggest to employ 3% as nominal value of the 15-40keV PIN NXB reproducibility at the 90% confidence level for the preparation of proposals (see, e.g., section 5.5.2).
|


|
The GSO background is higher than that of the PIN, and hence the background modeling accuracy is very important. The background model generation methods are similar to those applied for the PIN background.
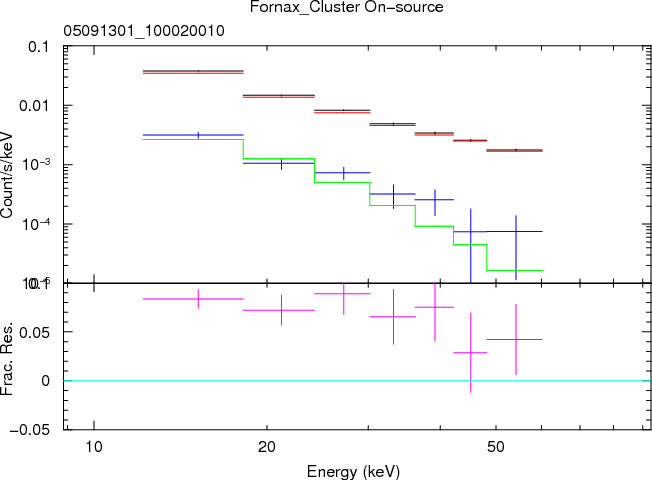
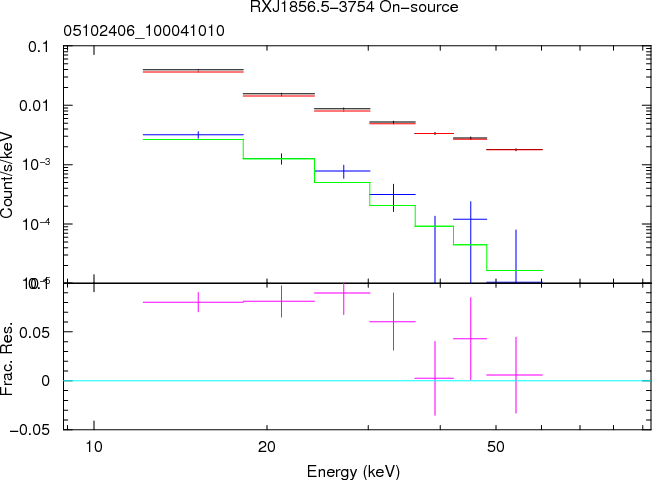
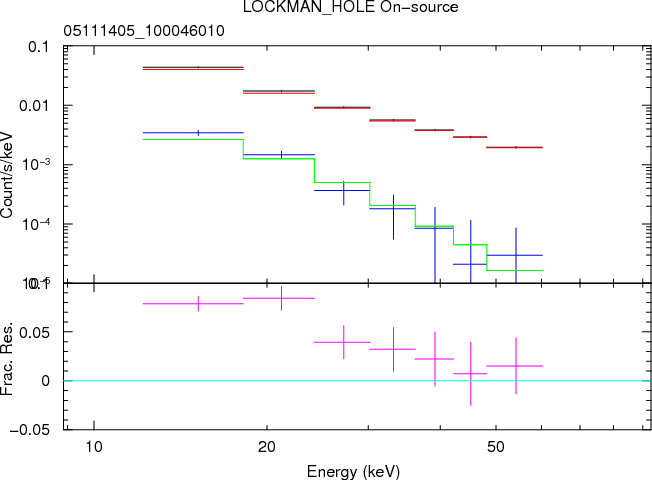
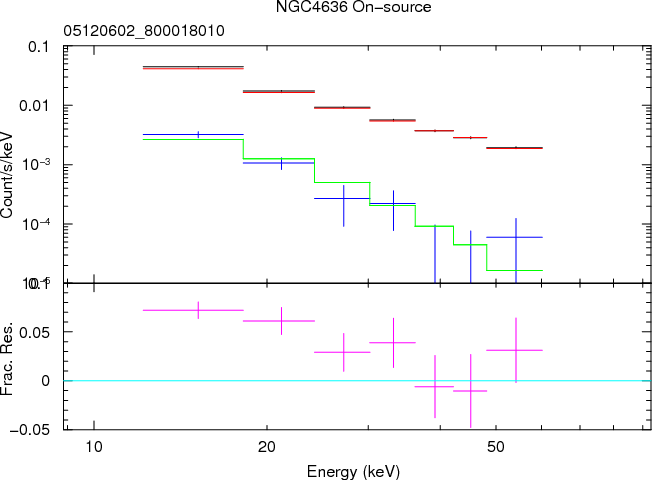
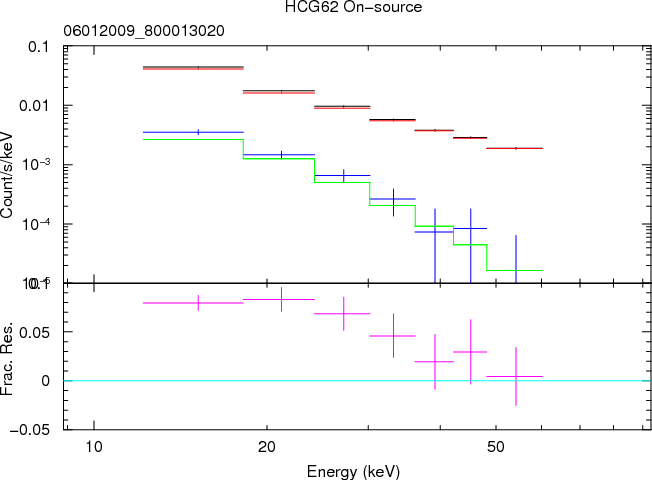
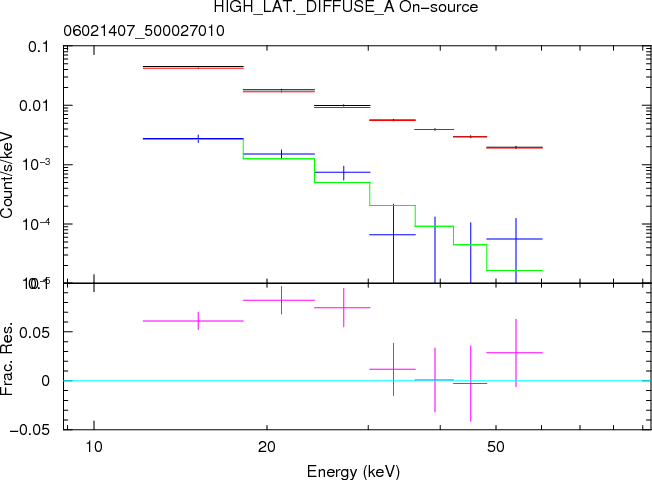
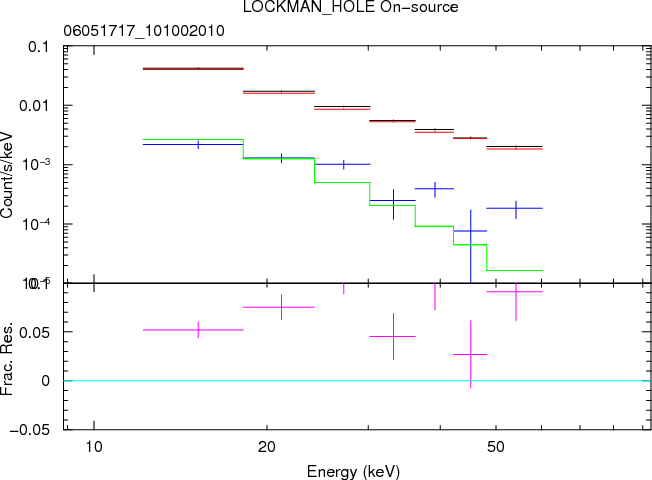
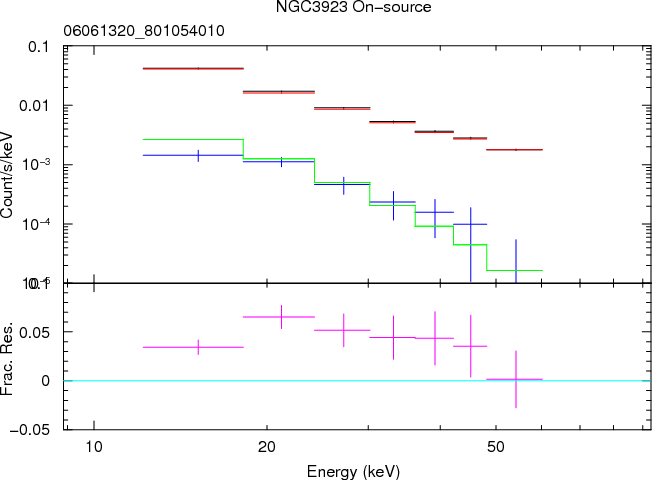
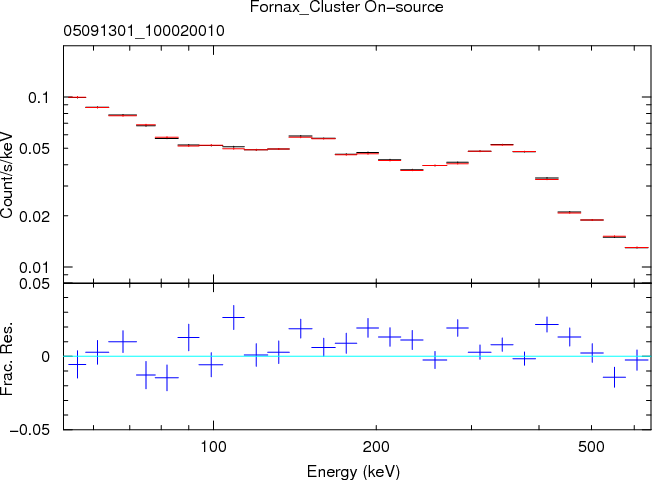
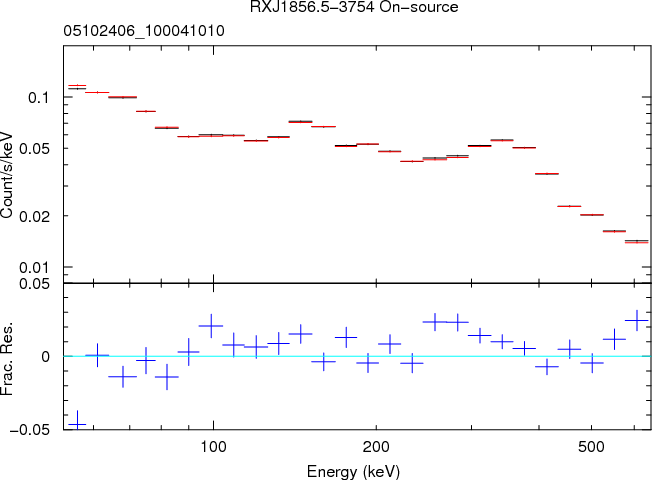
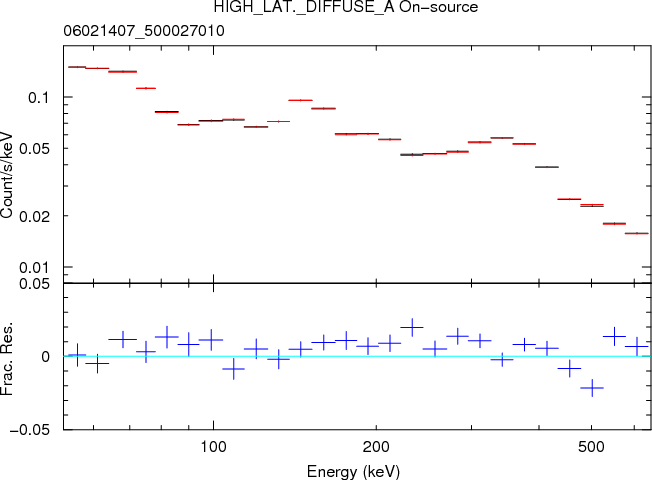
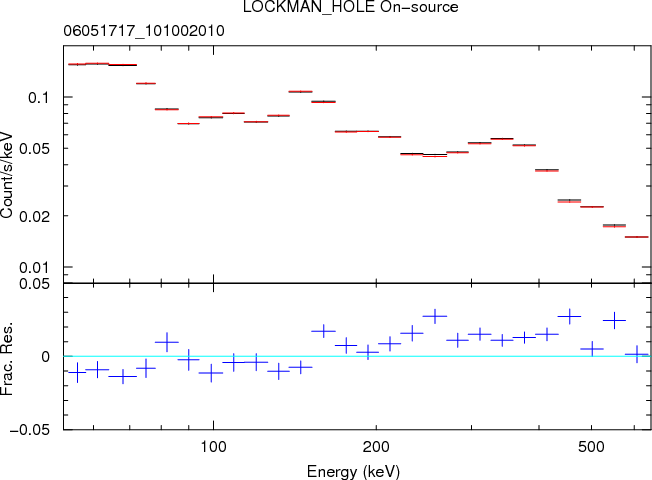
We compared the NXB model with the on-source data of dark objects, for which the source signal is expected to be negligible in the HXD-GSO. Examples for the comparison of spectra for eight dark objects are summarized in Figure 8.10. Unlike for the PIN, the CXB is negligible in the GSO band. The overall spectral shape is similar between the data and the background model spectra, where the latter is solely based on a template derived from Earth occultation data. In most cases, the residuals amount to 1-1.5% of the data. For simplicity, we therefore suggest to employ 1.5% as nominal value of the GSO NXB reproducibility at the 90% confidence level for the preparation of proposals (see, e.g., section 5.5.2).
|
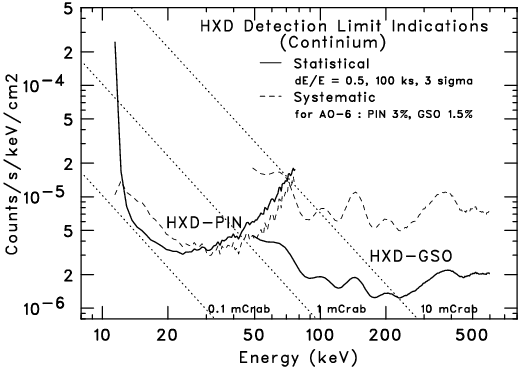
As a reference, Fig. 8.11 presents the theoretical sensitivity calculation results, that is, expected sensitivities defined by a certain systematic uncertainty of the background modeling, and those solely determined by the statistical uncertainty for a given exposure. In the plot, background reproducibility uncertainties of 3% and 1.5% are assumed as an example, for the PIN and the GSO, respectively. Since the actual statistical and systematic uncertainties that are to be expected for a proposed observation differ from case to case, they should be carefully verified using the data-NXB residual distribution plots.
HXD data are accumulated on event by event basis. After on-board data selection, event data are further screened by the ground pipeline analysis process. By referring to the trigger and flag information (including the inter-unit anti-coincidence hit patterns), the pipeline assigns specific grades to the HXD events such as pure PIN events and pure GSO events. Detector responses and background files that match the particular (i.e., default) grade of events are provided by the HXD team. There are no user-specified parameters for the HXD.
Tight active shielding of HXD results in a large array of guard
counters surrounding the main detector parts. These anti-coincidence
counters, made of ![]() cm thick BGO crystals, have a large
effective area for sub-MeV to MeV gamma-rays. With limited angular
(
cm thick BGO crystals, have a large
effective area for sub-MeV to MeV gamma-rays. With limited angular
(
![]() ) and energy (
) and energy (![]() % at 662keV) resolution,
they work as a Wide-band All-sky Monitor (WAM).
% at 662keV) resolution,
they work as a Wide-band All-sky Monitor (WAM).
Analog signals from normally four counters on each side of an HXD
sensor are summed up and a pulse height histogram is recorded every
second. If a transient event such as a Gamma-Ray Burst (GRB) is
detected, light curves with finer (31.25ms) time resolution are also
recorded in four energy bands. The energy coverage of the WAM extends
from ![]() keV to
keV to ![]() MeV, and its effective area is
MeV, and its effective area is ![]() cm
cm![]() at 100keV and 400cm
at 100keV and 400cm![]() at 1MeV. These data are
shared among the PI and the HXD team, i.e., the PI can use the full
WAM data set. Since such transient events, especially GRBs, require
immediate distribution to the community, the HXD team will make the
analysis products, such as light curves and spectra, public as soon as
possible at:
at 1MeV. These data are
shared among the PI and the HXD team, i.e., the PI can use the full
WAM data set. Since such transient events, especially GRBs, require
immediate distribution to the community, the HXD team will make the
analysis products, such as light curves and spectra, public as soon as
possible at:
http://www.astro.isas.jaxa.jp/suzaku/HXD-WAM/WAM-GRB.