

Gamma-Ray Burst Average Time History
Click image for larger view
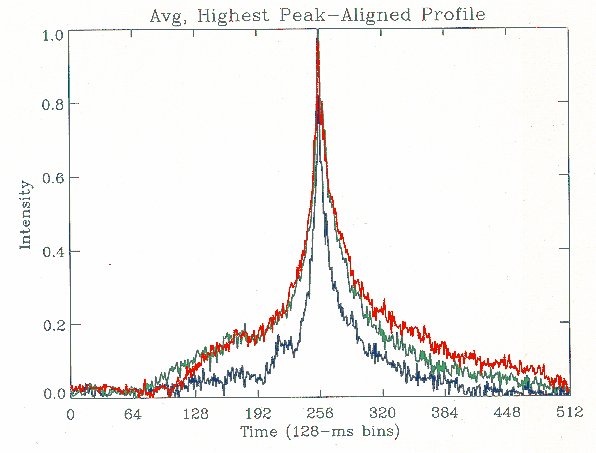
Although the nature of the gamma-ray burst sources remains a mystery, additional evidence for locating them at cosmological distances (far outside the Milky Way) comes from a comparison of the light curves (time histories). This plot illustrates the average time history for many bursts observed by BATSE divided into bright (blue) and dim (red and green) groupings. Within each group the burst time histories have been normalized to a maximum intensity of 1.0 and aligned at their highest peaks. The dim burst groups appear broader or stretched when compared to the bright group suggesting that a cosmological time dilation may be present.
If you have a question about CGRO, please contact us via the Feedback form.