Figure B.2: Instrument Sensitivity in the High-Range data.
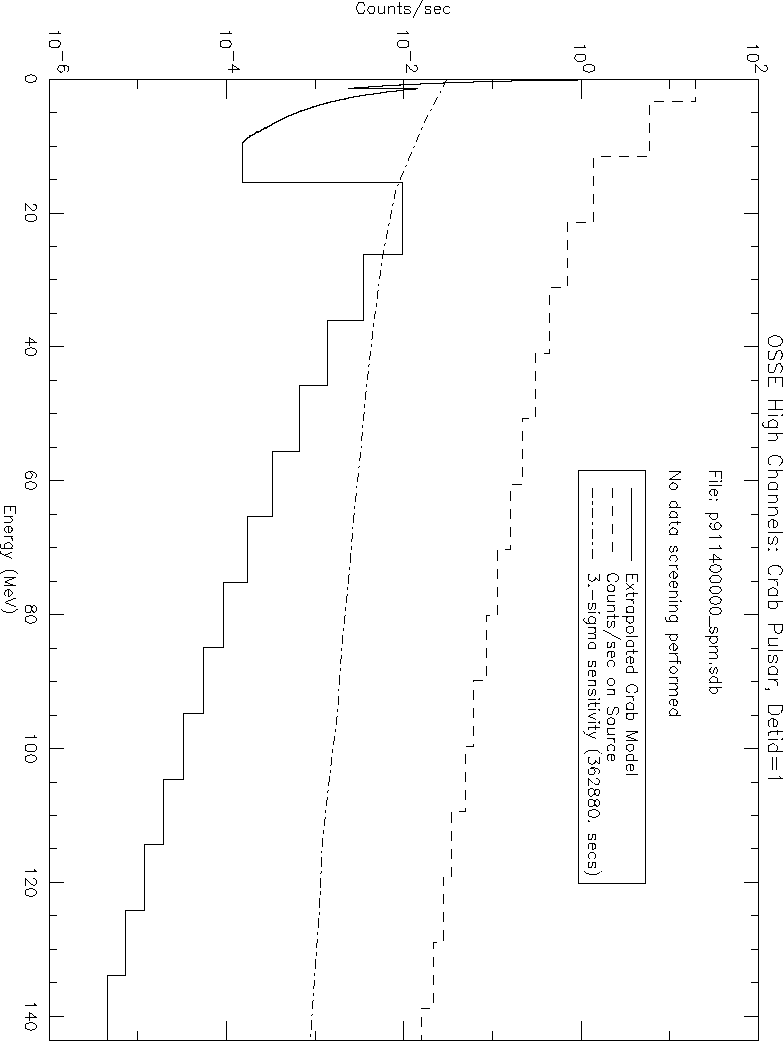
We then tried some explorations beyond the standard OSSE data analysis methods. We rephrased the question into "What count rate do we expect from the Crab pulsar in the OSSE high range?" To explore this question, we extrapolated the Crab photon flux model created below 10 MeV to above 10 MeV. We then convolved the model back through the OSSE response matrix to obtain an estimate of the OSSE counts in the high channels. Figure B.2 shows the result of this analysis. The jump in the count rate below 20 MeV is due to the narrower energy channels from the low and medium-energy range. We also include the count rate per channel for on-source (non-background subtracted) pointings. The counts are normalized with the detector live-time appropriate for the high-range data. Off-source pointings would be indistinguishable from the on-source pointings on this scale. We also compute the 3-sigma instrument sensitivity with this background.
Figure B.2: Instrument Sensitivity in the High-Range data.
Source counts are less than one per channel per two-minute dwell at 20 MeV. The background counts are higher by a factor of 100. There is no clear way to perform the background subtraction. We also examined data where we screened out the high background count rates due to passage of the spacecraft through the South Atlantic Anomaly. There was no significant improvement in sensitivity.
Another way to improve instrument sensitivity is to accumulate lots of data. However, to increase the sensitivity by a factor of 10 requires an increase in exposure time by a factor of 100 - four years of exposure. Not exactly a practical observation, particularly when many of the sources of interest in this range fluctuate on timescales of a few days.