Hitomi Science Gallery
 |
 |
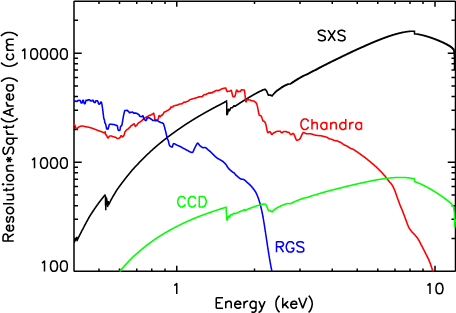
| SXS line resolving power |
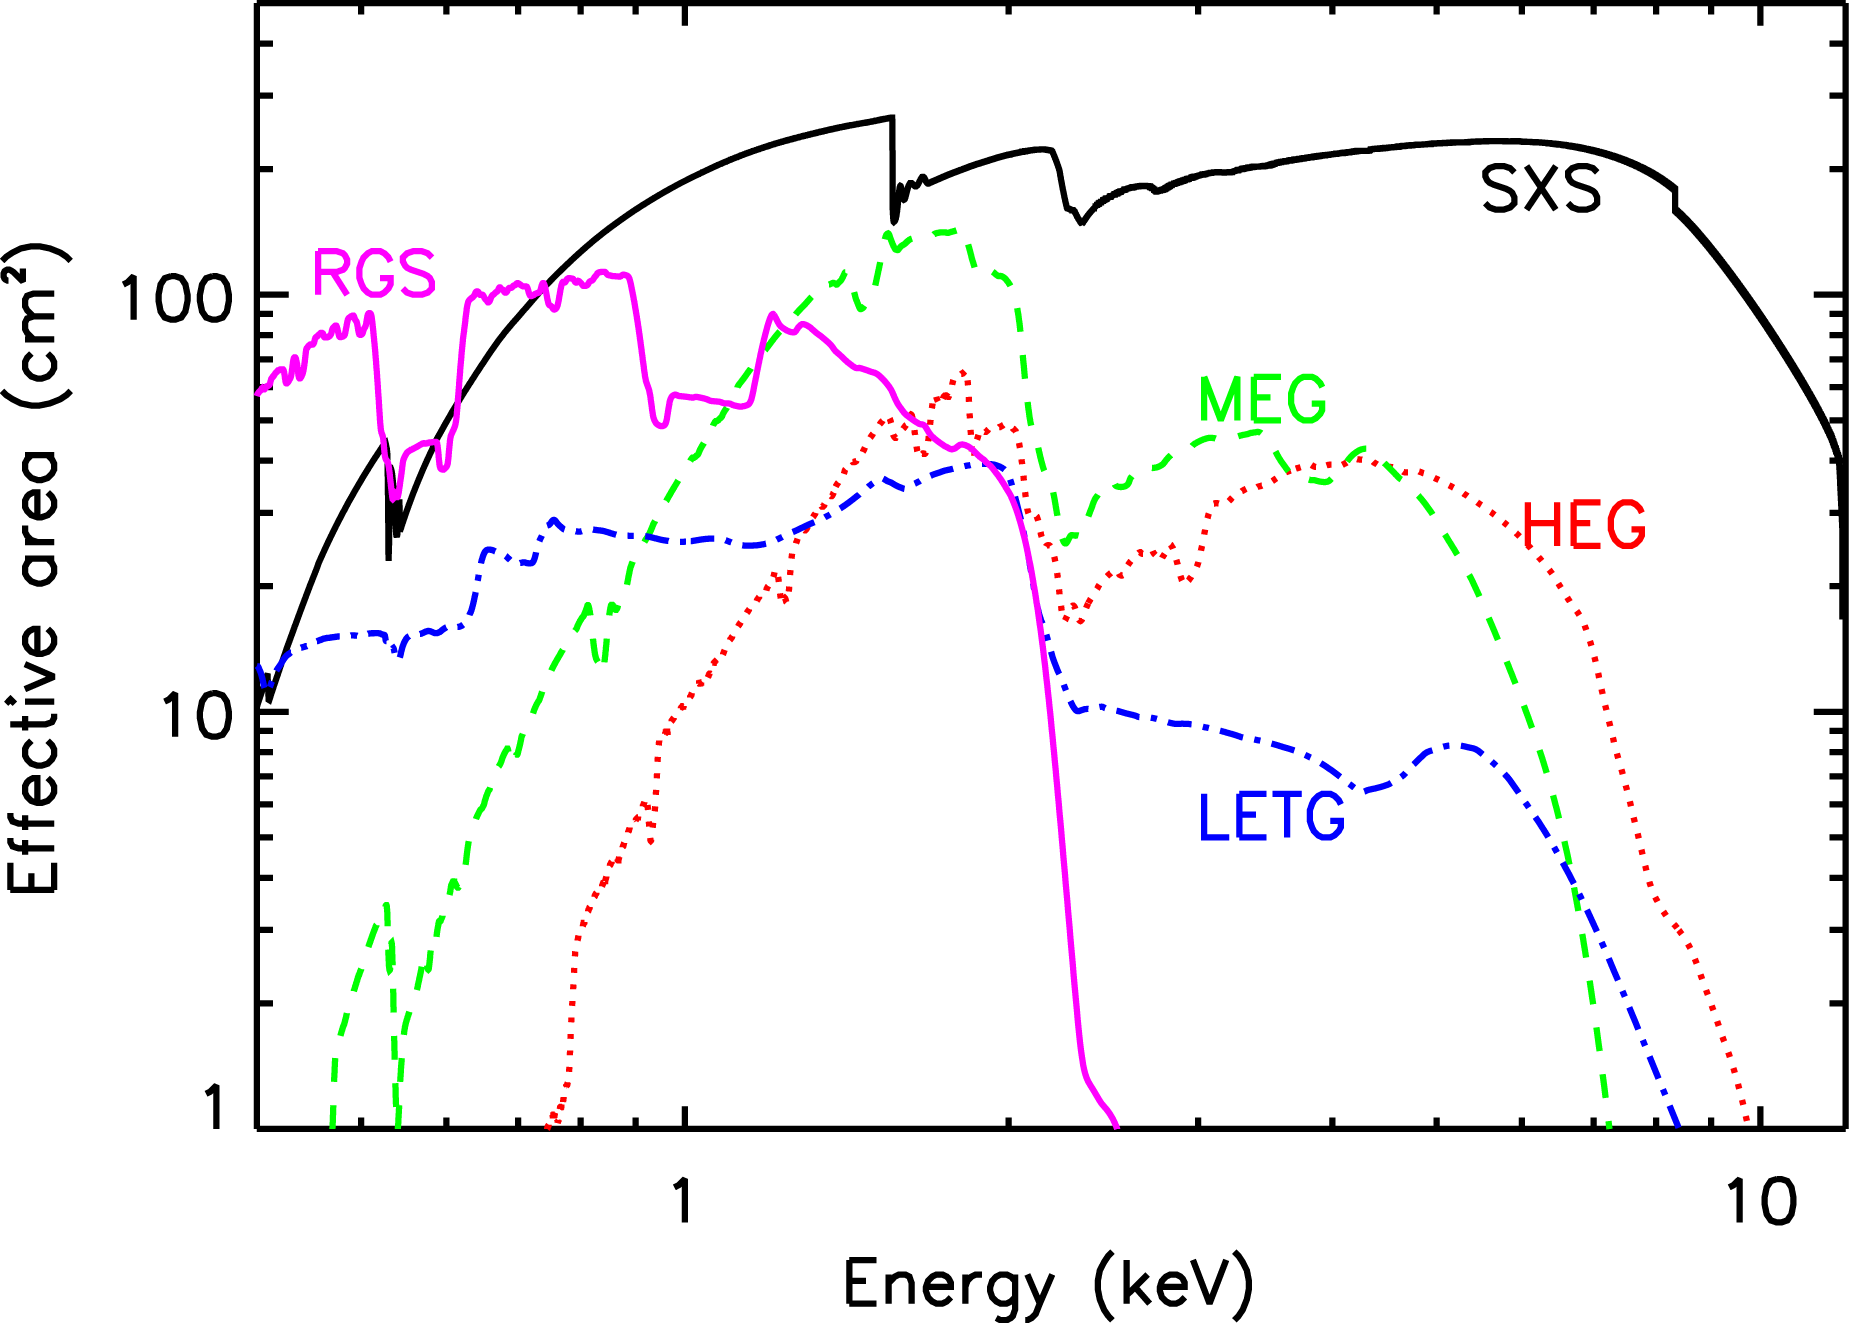
SXS effective area |
 |
| Perseus Cluster Chandra (right) overlaid with the Hitomi SXS detector (yellow line) to show the location from where the Hitomi 6-7 keV spectrum was derived (left) |
|
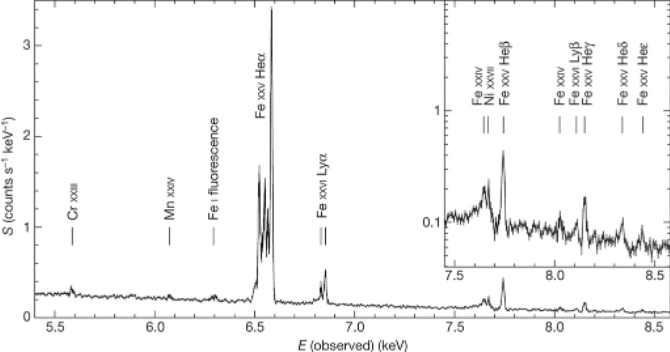
Full array spectrum of the core of the Perseus cluster obtained by the Hitomi observatory
|
| |
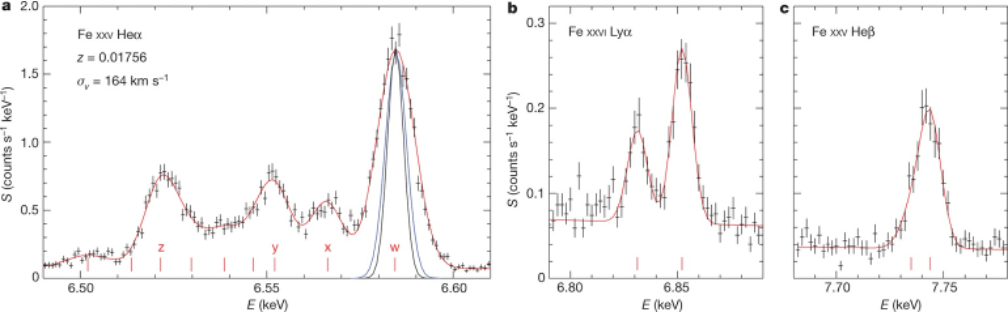
Spectra of Fe XXV Heα, Fe XXVI Lyα and Fe XXV Heβ from the outer region |
| |
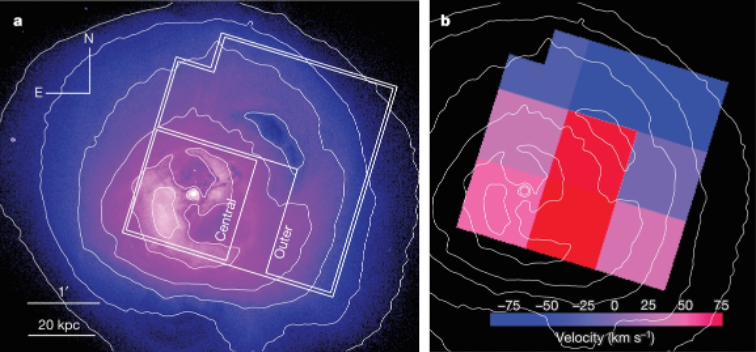
The region of the Perseus Cluster observed by Hitomi |
|
The three figures above come from “The Hitomi Collaboration,”
Nature, 535, 117–121 (2016) doi:10.1038/nature18627
|
|