Next: 3.4.3 RGS Order Separation Up: 3.4 REFLECTION GRATING SPECTROMETER (RGS) Previous: 3.4.1 Diffraction Geometry
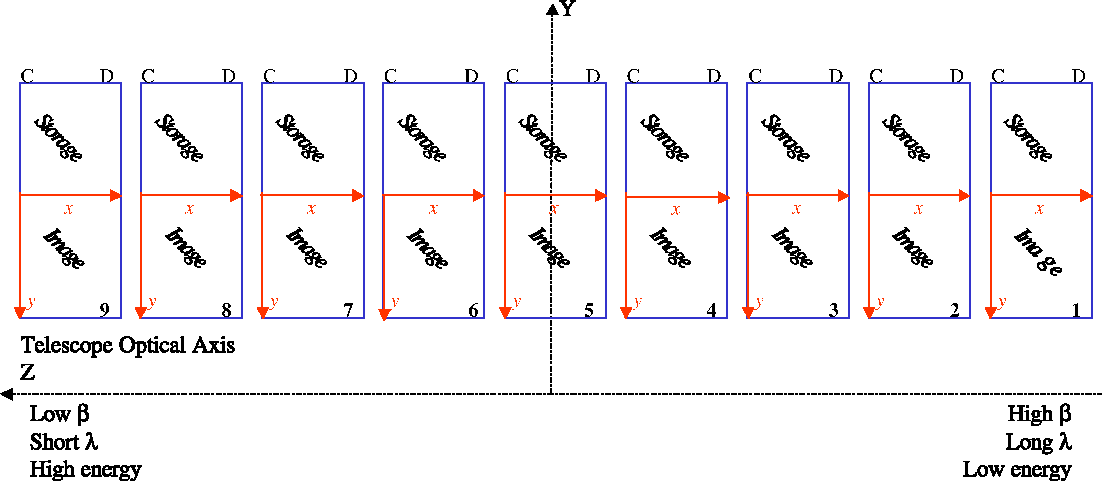 |
Fig. 77 displays a sketch of the chip geometry in an RFC. The two RFCs are offset with respect to each other along the dispersion direction so as to fill the gaps in each other's in order to provide continuous coverage along the dispersion direction. The interchip gap between adjacent CCDs is about 0.5 mm corresponding to 85 mÅ and 45 mÅ at short and long wavelengths, respectively. The dispersion direction is along the spacecraft -Z axis. Higher energies, shorter wavelengths, are dispersed to higher values in Z and to lower dispersion angles.
The chip on the right of Fig. 77 has number 1 (the low Z end of the coordinate scale), and the one on the left is number 9 (largest Z value, smallest dispersion angle and highest energy or smallest wavelength). The user is referred to the XMM-Newton Calibration Access and Data Handbook for details of the coordinate systems.
For an on-axis source, the individual chips cover approximately the energy ranges listed in Table 9. Simulations should be performed in case the user is interested in lines that could fall close to the chip boundaries. To shift important lines away from chip boundaries or inoperative CCDs, users may want to consider changing the diffraction geometry by moving the spacecraft pointing away from the usual boresight through explicit control of the incidence angle. For this purpose the task 'rgslinepos', provided as part of the XMM-Newton Science Analysis System SAS, computes the position of a given wavelength in CCD coordinates. Large offsets in the dispersion direction are not recommended as this reduces the overall effective area significantly. Care also has to be taken to ensure that the source does not fall on or close to an EPIC CCD gap. Last, the fact that offset pointing requires a particular position angle implies a smaller visibility window for the observation.
The exact location of a source spectrum on the RGS CCD chips depends on the source's location within the field of view of the X-ray telescopes. For a target on-axis the observed spectrum is centred on the RFC chips in the cross-dispersion direction. The wavelength scale for sources off-axis in the cross-dispersion direction is the same as for those on-axis, but is offset for sources off-axis in the dispersion direction. The offline data analysis with SAS takes care of the source position.
| Chip | RGS1 | RGS2 | ||
| Energy [keV] | Wavelength [Å] | Energy [keV] | Wavelength [Å] | |
| 1 | 0.32 - 0.37 | 33.6 - 38.2 | 0.33 - 0.38 | 32.7 - 37.3 |
| 2 | 0.37 - 0.43 | 29.0 - 33.5 | 0.38 - 0.44 | 28.2 - 32.6 |
| 3 | 0.43 - 0.50 | 24.8 - 28.9 | 0.44 - 0.52 | 24.1 - 28.1 |
| 4 | 0.50 - 0.59 | 20.9 - 24.7 | (0.52 - 0.62) | (20.0 - 24.1) |
| 5 | 0.60 - 0.72 | 17.2 - 20.8 | 0.62 - 0.75 | 16.5 - 20.0 |
| 6 | 0.73 - 0.90 | 13.8 - 17.1 | 0.76 - 0.94 | 13.2 - 16.4 |
| 7 | (0.90 - 1.18) | (10.6 - 13.8) | 0.95 - 1.23 | 10.0 - 13.1 |
| 8 | 1.18 - 1.60 | 7.8 - 10.6 | 1.24 - 1.71 | 7.2 - 10.0 |
| 9 | 1.61 - 2.41 | 5.2 - 7.7 | 1.73 - 2.64 | 4.7 - 7.2 |
European Space Agency - XMM-Newton Science Operations Centre