Next: 3.4.4 In-Flight Performance Up: 3.4 REFLECTION GRATING SPECTROMETER (RGS) Previous: 3.4.2 RFC chip arrays
X-rays are reflected into first and second spectral orders with the highest efficiency, and thus produce the most useful data. Count rates in the third order are about 8 times lower than in second order. Depending on grating order, the RGS covers the energy ranges listed in Table 10.
| Order | Wavelength range [Å] |
| -1 | 6 - 38 - 38 |
| -2 | 6 - 20 |
| -3 | 6 - 10 |
Practical limitation due to very low effective area below 6 Å.
The theoretical lower limit is -5/m Å, where m is the order number.
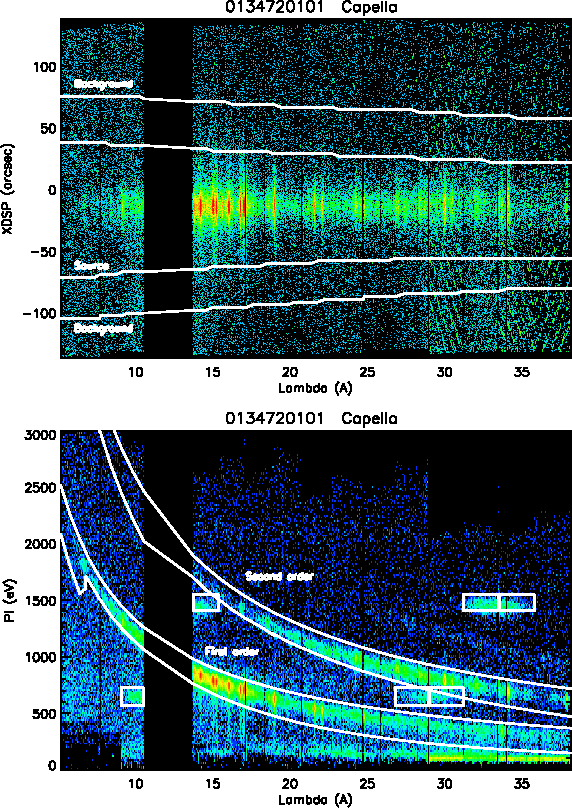
A consequence of the diffraction equation (1) is that orders overlap on the CCD detectors of the RFC (see Fig. 78, top panel). Separation of the spectral orders is achieved by using the intrinsic energy resolution of the CCDs, which is about 160 eV FWHM at 2 keV. The dispersion of a spectrum on an RFC array is shown in the bottom panel of Fig. 78. First and second orders are very prominent and are clearly separated in the vertical direction (i.e. in CCD energy, or PI space). Photons of higher orders are also visible for brighter sources. The calibration sources can also be seen in the bottom panel as short horizontal features.
 |
European Space Agency - XMM-Newton Science Operations Centre