November 1999 from the BeppoSAX Calendar
November
Sun Mon Tue Wed Thu Fri Sat
     1   2   3   4   5   6
 7   8   9  10  11  12  13
14  15  16  17  18  19  20
21  22  23  24  25  26  27
28  29  30
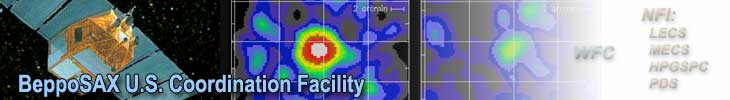
 The BeppoSAX LECS+MECS best fit spectrum of the Circinus Galaxy
(plot to the left) shows a flat continuum and very strong iron emission.
The extrapolation of this 0.1-10 keV spectrum to higher energies (PDS data)
shows a further component, likely due to nuclear radiation transmitted trough
a thick (~4x1024 cm-2) absorber. Independent evidence
of this absorber is shown on the right image taken in the near infrared
(H-K color): the yellow-white lane is thought to trace a dusty-gaseous
bar that drives gas into the nuclear region causing the absorption inferred
from the X-rays.
Courtesy of G Matt, III University, Rome, Italyand R. Maiolino,
Arcetri Observatory, Florence, Italy
The BeppoSAX LECS+MECS best fit spectrum of the Circinus Galaxy
(plot to the left) shows a flat continuum and very strong iron emission.
The extrapolation of this 0.1-10 keV spectrum to higher energies (PDS data)
shows a further component, likely due to nuclear radiation transmitted trough
a thick (~4x1024 cm-2) absorber. Independent evidence
of this absorber is shown on the right image taken in the near infrared
(H-K color): the yellow-white lane is thought to trace a dusty-gaseous
bar that drives gas into the nuclear region causing the absorption inferred
from the X-rays.
Courtesy of G Matt, III University, Rome, Italyand R. Maiolino,
Arcetri Observatory, Florence, Italy
Images courtesy of the Agenzia Spaziale Italiana (ASI) and the
BeppoSAX Science Data Center (SDC).
If you have any questions concerning
BeppoSAX
go to the
Feedback form.