
Profit's intuitive interface is designed to make most operations
straightforward. Most features are accessed by simply clicking on a
button or selecting a region. However, some features require short
explanations. |
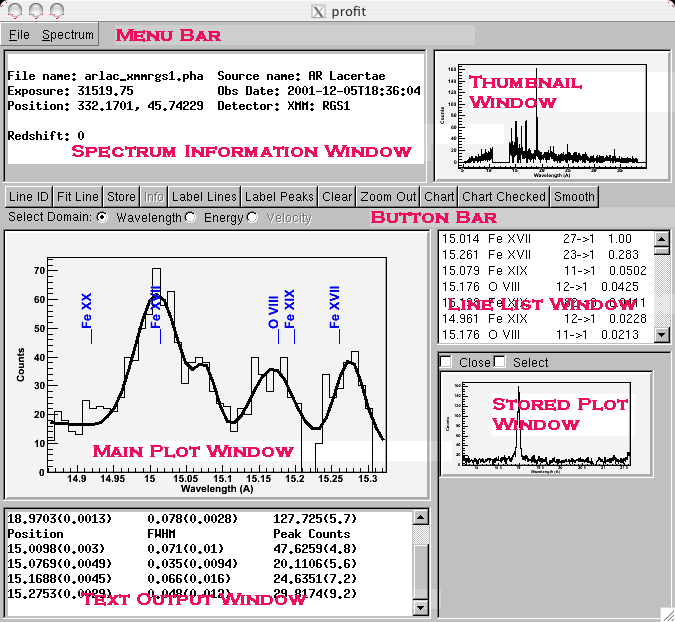 |
| A sample Profit session, showing an XMM RGS observation of AR Lac with the primary windows labelled in red. |
| Loading and Identifying a Spectrum | The Spectrum Information Window will always show the filename and other relevant information (source name, observation date, exposure time, etc) for the currently displayed plot. If multiple spectra have been loaded into Profit, they can be brought forward using the Spectrum menu, in the Menu Bar. To load a new window, use the "Open " command under the File menu. | Selecting a spectral region | This is done by clicking in the Main Plot Window, either on the plot itself or its x-axis, with the left mouse button, and dragging (ie, holding the mouse button down) to the right until you have selected the region of interest. If you overshoot, simply reselect on the new region; if you undershoot, the "Zoom Out" button (on the Button Bar) allows you to expand the selected region slightly. To restore the entire spectrum, double-click on the Thumbnail Window at the top right. | Line identification | The "Line ID" button fills the Line List Window with a list (based on the atomic database in use) of the lines or features in the selected range shown in the main plot window. The lines are sorted by estimated intensity, scaled so that the brightest possible line in the selected range has intensity 1.000. These intensity estimates can easily be wrong, so should only be used as a rough guide when identifying lines. |
| The "Label Lines" button shows all lines present in the displayed spectrum. This can be cleared using the "Clear" button. | |
| The "Label Peaks" button first attempts to identify peaks in the observed spectrum, and then uses a simple algorithm that uses the location and estimated strength of the possible matching emission lines to label these features. It can fail if there are too many features (more than 50-100) present in a spectrum, in which case a message will be printed in the Text Output Window. | Velocity Space | Profit can calculate the velocity shift for a spectrum if told what atomic line to use for v=0. To switch into velocity space, select a line in the line id list, and then click on "Velocity." in the second line of the Button Bar. | Line fitting | Line fitting is a difficult problem, which Profit has only begun to touch. At the moment, Profit attempts to fit the spectrum shown in the Main Plot Window using a straight line for the continuum and a series of gaussians for line emission. The algorithm can be confused by a spectrum with many lines, a curved continuum, or simply a small number of counts in each bin. These problems are intrinsic to non-linear fitting and should not be considered "bugs" per se. However, the code works reasonably well when there are only a small number of well-separated lines with 50 or more counts and a flat continuum. | Storing Plots | Profit can "store" plots in the main window into the Stored Plot Window. These plots can be brought back to the main window by double-clicking on them, or deleted by clicking the Close button above each plot (only one stored plot is shown here). To create a single plot showing multiple stored plots, simply click the Select button for each desired plot and then click the "Chart Checked" button in the Button Bar. |
If you have any questions concerning Profit, please visit the Feedback form.
HEASARC Home | Observatories | Archive | Calibration | Software | Tools | Students/Teachers/Public
Last modified: Monday, 14-Nov-2005 18:54:26 EST