 |
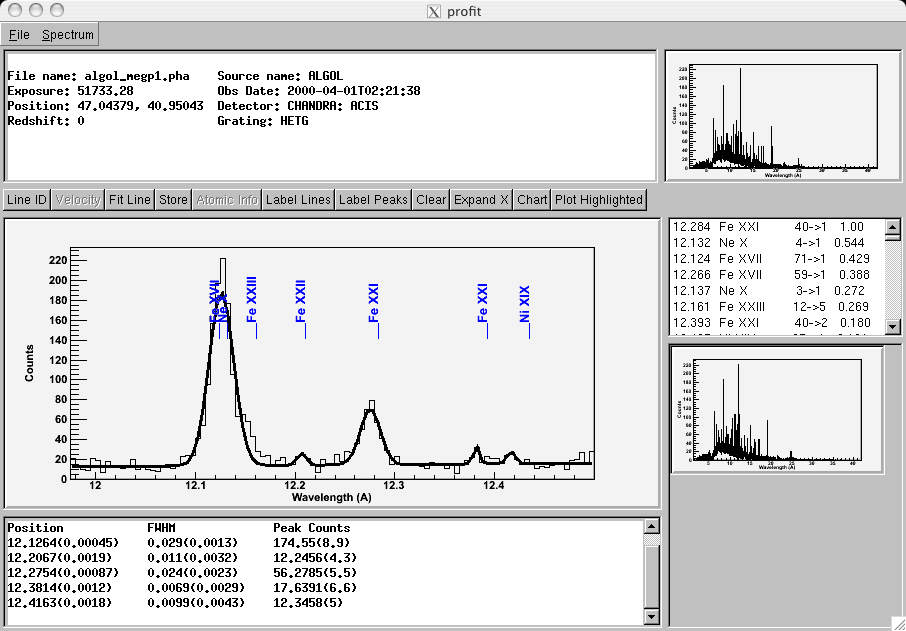
| As seen above, Profit can be used to "browse" a spectrum to simply scan regions of interest and make preliminary identifications. |
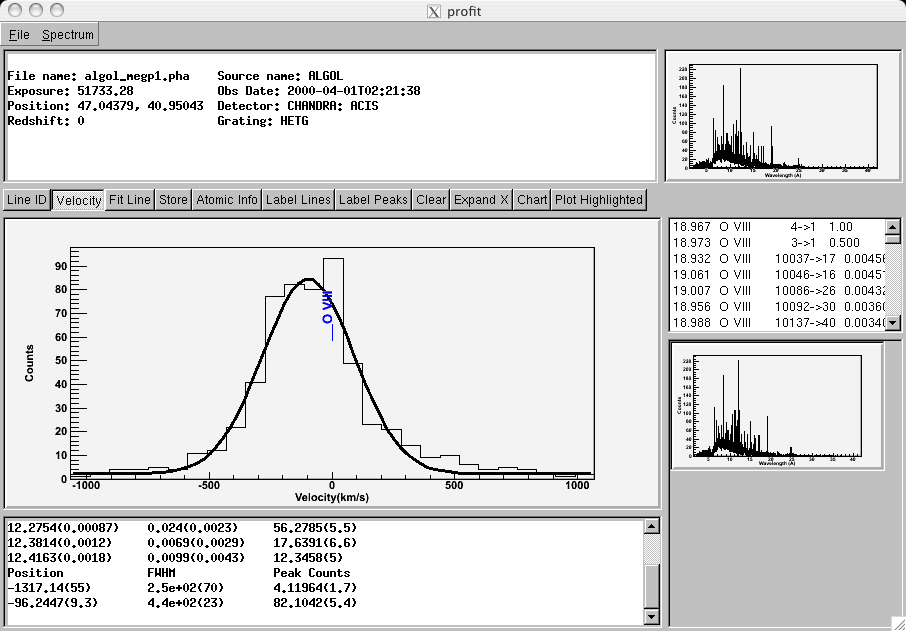 |
| Profit can also be used to measure the velocity profile of an
emission line, in this case the O VIII Ly Alpha line. The line is
slightly offset, suggesting either a doppler shift or a systematic data
error. |
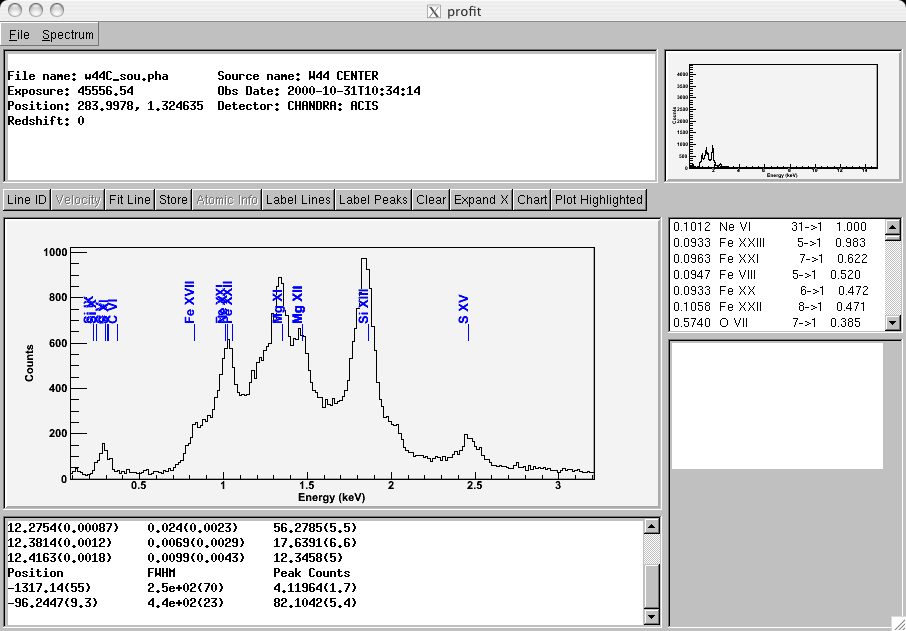 |
| Profit will also work with CCD resolution data, in fact any
spectral data stored as a PHA file or even simply as a text file. In
addition, profit works in both wavelength units (as shown in the first two screenshots) and in energy units as shown above. |
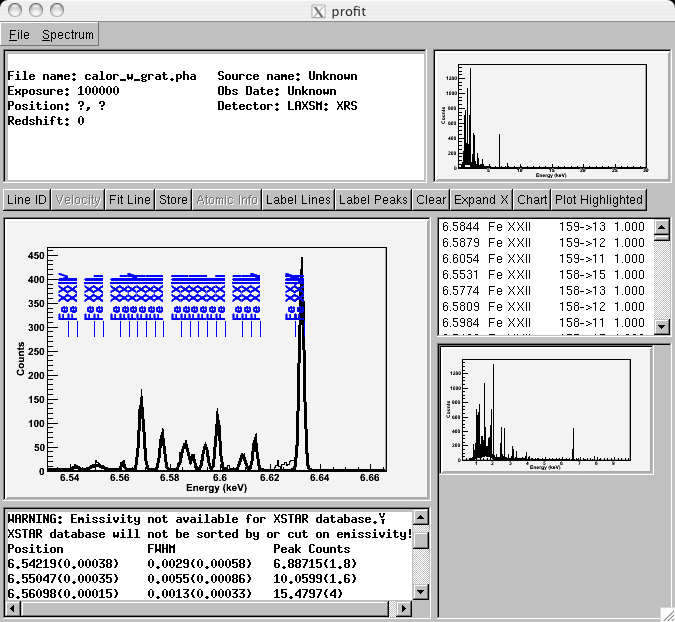 |
| Profit can use multiple atomic databases. Here the Fe K lines
from the XSTAR database are used to label the features seen in this
Con-X simulation. |
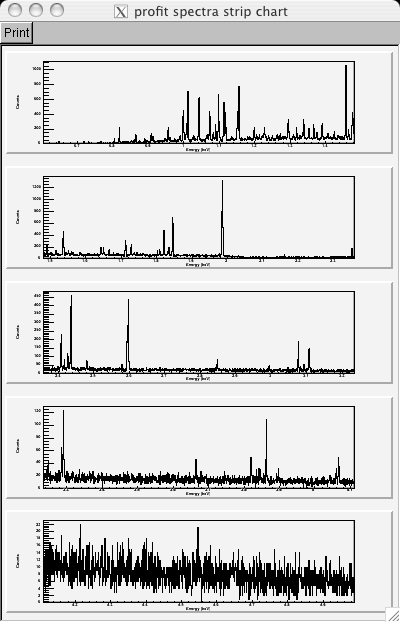 |
| Profit also has some "convenience" features. Here,
the Chart button has broken the Con-X spectrum shown in the previous
screenshot into 5 spectra, allowing individual features to be more
easily seen. |
