Welcome TESS followers to our latest news bulletin! This week, we are looking at three recent papers from the archive. Enjoy!
Temporal albedo variability in the phase curve of KELT-1b (Parviainen 2023) :
KELT-1b is a highly-irradiated transiting brown dwarf with an orbital period of 1.2 days producing prominent secondary eclipses as well as ellipsoidal modulations and Doppler beaming. Previously, ground-based, Spitzer and CHEOPS observations have been used to estimate a dayside brightness temperature of about 2,900 K. TESS photometry from Sector 17 has, however, indicated a much brighter than expected dayside, in disagreement with the Spitzer and CHEOPS measurements after taking into account the passband differences. Parviainen (2023) combines TESS data from Sectors 17 and 57 to address this discrepancy. The author models the phase curve of KELT-1b and shows that the dayside brightness varies between the two TESS visits. Specifically, the dayside flux ratio changes from 6.1+/-0.9 % for Sector 17 to 1.3+/-0.7% for Sector 57, and the eclipse depth changes from 360+/-50 ppm for Sector 17 to 74+/-42 for Sector 57. Parviainen (2023) notes that the timescales of the observed variability are likely long and argues that the discrepancies between TESS, Spitzer, CHEOPS and ground-based observations are most likely due to variations in the brown dwarf's cloud cover. Thanks to TESS data, the author was able to offer a potential solution to a long-standing issue with the dayside brightness of KELT-1b.
Starspot mapping with adaptive parallel tempering. II. Application to TESS data for M-dwarf flare stars, AU Microscopii, YZ Canis Minoris, and EV Lacertae (Ikita et al. 2023) :
AU Microscopii (AU Mic), YZ Canis Minoris (YZ CMi), and EV Lacertae (EV Lac) are magnetically-active M-dwarfs producing frequent flares and exhibiting prominent photometric variability. AU Mic is also a host to a resolved debris disk and two warm Neptunes, and its surface is likely spotted. Zeeman Doppler imaging has indicated the presence of polar spots on YZ CMi and EV Lac. However, the stellar surfaces of the three stars cannot be directly resolved, and thus the exact location of the starspots is not well known. To study the connection between starspots and stellar flares for these three M dwarfs, Ikita et al. (2023) use 2-min TESS data from Cycles 1, 2, and 3. From the observed photometric variability, the authors measure rotation periods of about 4.8 days for AU Mic, 2.8 days for YZ Cmi, and 4.4 days for EV Lac. Ikita et al. (2023) perform starspot modeling and suggest that the rotation phase is not strictly correlated to the flare rate, indicating that flares can occur at any rotation phase. Capitalizing on TESS data, they note that while the flare rate for AU Mic and YZ CMi has not changed significantly during the TESS observations, both the shape and the amplitude of the corresponding lightcurve variability do change with time. The authors attribute this to variations in the spot size and location on the stellar surface.
FluxCT: A Web Tool for Identifying Contaminating Flux in Kepler and TESS Target Pixel Files (Schonhut-Stasik & Stassun 2023) :
Flux contamination is a known issue when analyzing photometric time-series observations. Depending on how crowded the field of view is and how large the pixels are, it can be anywhere from a nuisance to a serious issue. In the latter case, flux contamination may result in inaccurate results, persistent false positives, and even hamper new discoveries. Schonhut-Stasik & Stassun (2023) present a new tool, FluxCT, designed to address this issue by using the TESS target's pixel aperture and Gaia database. The tool queries the latter for potentially contaminating sources using a unique search polygon for each target. Using only the target ID as input, FluxCT creates a plot containing the nearby resolved sources, highlighting the corresponding magnitude differences, flux ratios and total contaminated flux, and also the Renormalized Unit Weight Error (RUWE) as measured from Gaia. The authors tested their tool on 147 Kepler stars exhibiting lightcurve oscillations and compared the results to those from a standard cone search with a radius of 4 arcsec. Schonhut-Stasik & Stassun (2023) found that while the latter identified 23 contaminating sources, FluxCT identified 107, and argued that the FluxCT provides a better representation of the flux contamination. FluxCT is freely-available as a web-based tool.
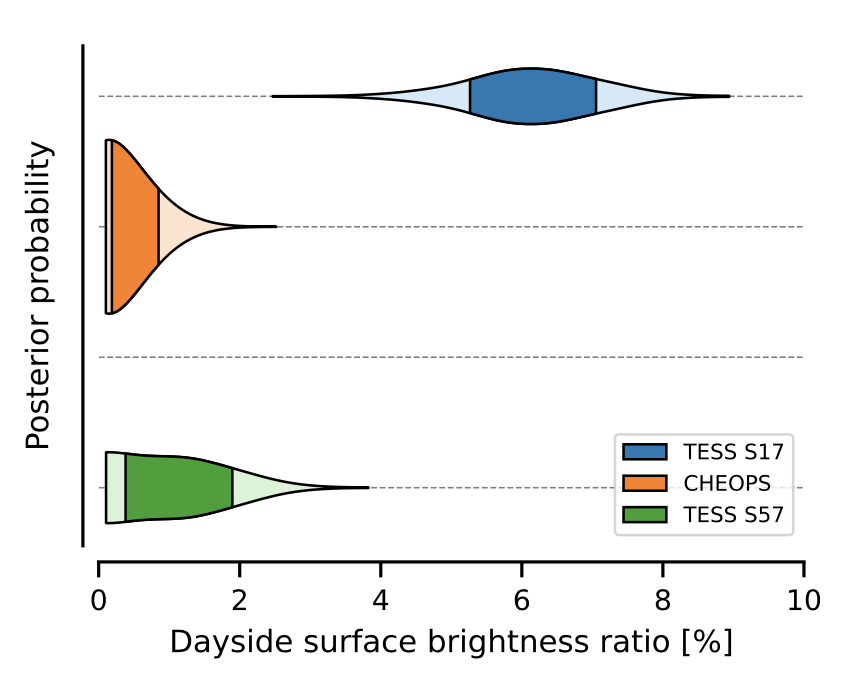
Fig. 1: Taken from Parviainen (2023). Flux ratio posteriors between the KELT-1b brown dwarf and its host star measured from TESS and CHEOPS observations.
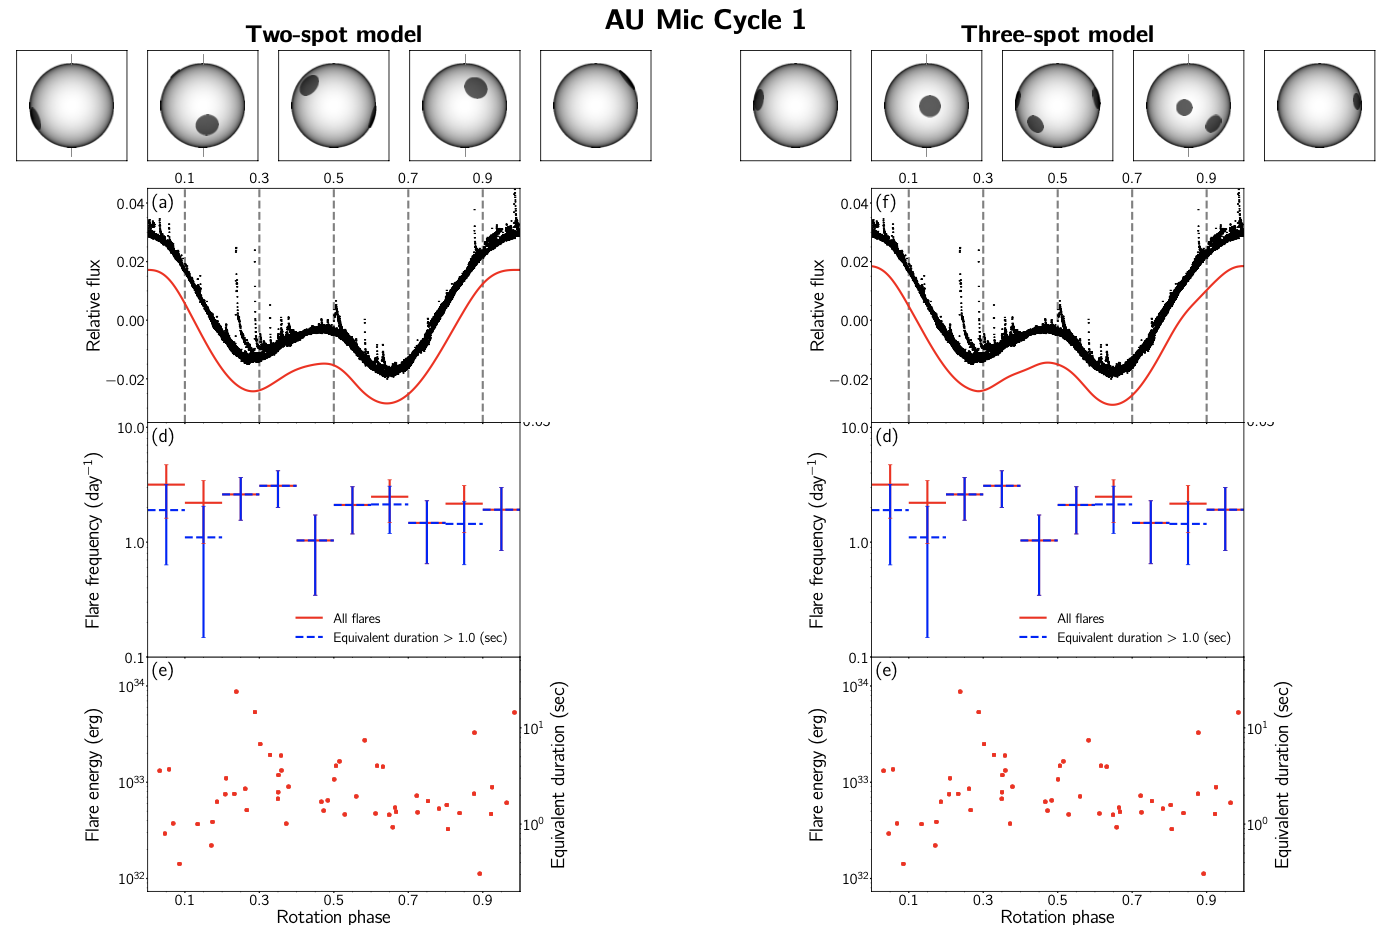
Fig. 2: Taken from Ikita et al. (2023). First row: simulated visible surface of AU Mic during Cycle 1 for a model with two spots (left) and a model with three spots (right) at rotation phases of 0.1, 0.3, 0.5, 0.7, and 0.9. Second row: Phase-folded TESS lightcurve (black) along with the best-fit spot model (red). Third row: Flare rate as a function of the rotation phase. Fourth panel: Corresponding flare energy and equivalent duration as a function of the rotation phase.
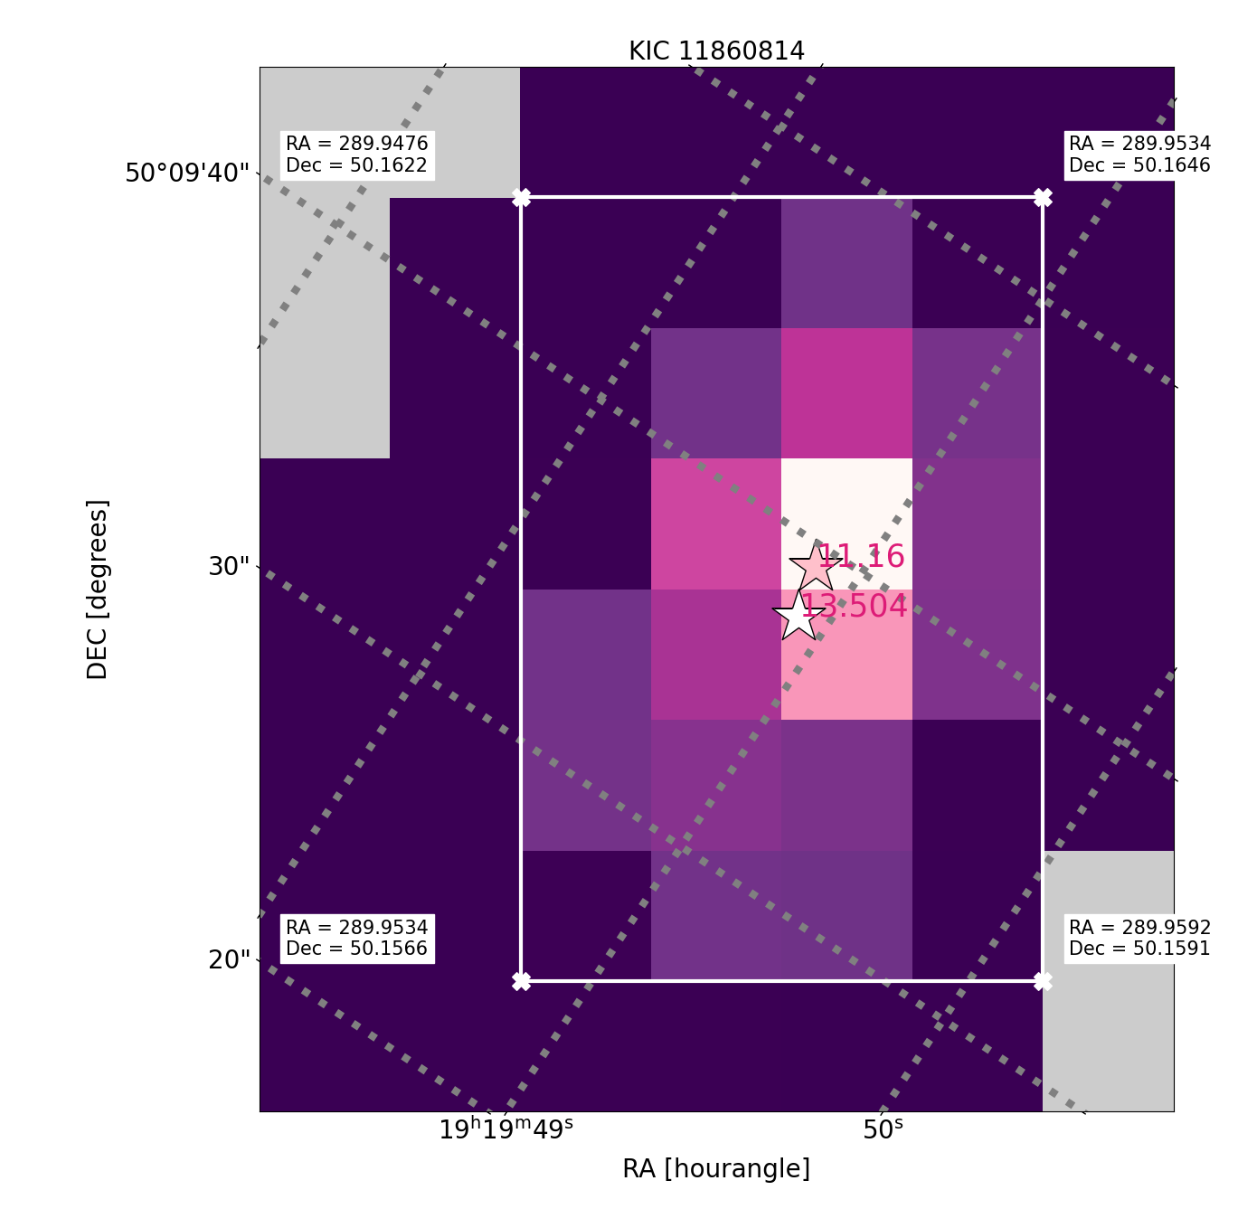
Fig. 3: Taken from Schonhut-Stasik & Stassun (2023). Example output figure from FluxCT for KIC 11860814. The light purple to white color represents pixels included in the target pixel aperture, while dark purple color represents pixels not included in the target pixel aperture. The white lines indicate the smallest possible polygon centered on the target (pink star). The white star represents a contaminating nearby star with a magnitude difference of about 2.