

Time Assignment of ASCA GIS
M. Hirayama^1, F. Nagase^2, S. Gunji^3,
Y. Sekimoto^1, Y. Saito^1
1:Deptartment of Physics, University of Tokyo,
2:Institute of Space and Astronautical Science,
3:Yamagata University
1 Time Assignment for GIS events
This report summarizes the calibration status on time assignment accuracy of the ASCA GIS data from two different points of view; one is on the reliability of photon arrival times of the GIS events when the observation is performed with no timing bit in PH mode; the other is on the "absolute time keeping", or how well ASCATIME relates to UTC (Coordinated Universal Time). Before discussing these, we first review a sequence of time assignments for the GIS data. In the review we introduce a few key quantities to discuss the reliability. There are two steps to assigning photon arrival times to GIS events; first a telemetry time is assigned to each "frame" (see below) at ground stations receiving the ASCA data; then the photon arrival time is estimated from the telemetry time in data analysis by observers with a program such as "frfread".
1.1 Assignment of Telemetry Time
All the ASCA data are arranged in a "frame" following a telemetry format by a common data processor (DP). The frame consists of 128 "words" which consists of eight bits and is divided into three sections; each of which includes SIS data, GIS data, and house keeping data. The largest unit of data is called a "superframe" which consists of 64 frames. The structure of the super frame is illustrated in figure 1. Lengths of the super frame components are listed in table 1.
Figure 1: Structure of a telemetry format. One super frame consists of 64 frames which consists of 128 words = 1024 bits. The frame is divided into three sections, each of which includes SIS data, GIS data, and common data indicating satellite's status.
	Bit Rate	Word 		Frame		Super Frame
	_____________________________________________________________

	Low		7.813 ms	1.0 sec		64.0 sec

	Medium		1.953 ms	250.0 ms	16.0 sec

	High		244.14 ms	31.25 ms	2.0 sec
The data is stored into a bubble data recorder (BDR) with each frame having a 24 bit integer value, indicating when the frame is edited by DP. The integer value is given as an output of a satellite timer, which counts pulsed signals of a crystal oscillator aboard the satellite. The stored data is sent to ground stations through a radio wave; one of the ground stations is at the Kagoshima Space Center (KSC) of ISAS, another is the Deep Space Network (DSN) stations of NASA.
At the ground stations the telemetry time of each frame is estimated from the
satellite timer's output of the frame and the time when the frame is received
at the station. In the estimation a drift in oscillating frequency of the
crystal oscillator is taken into account by monitoring the temperature of the
oscillator every 31.25ms, as well as correcting a time for the radio wave to
travel from the satellite to the station using the orbital parameters of the
satellite. The stability of the oscillator's frequency after the temperature
correction was estimated as
 in the pre-flight calibration. The telemetry time of the event is known as
UTC since the satellite timer is well calibrated to UTC through comparison of
the satellite timer's output with a time kept by an atomic clock at KSC.
in the pre-flight calibration. The telemetry time of the event is known as
UTC since the satellite timer is well calibrated to UTC through comparison of
the satellite timer's output with a time kept by an atomic clock at KSC.
1.2 Estimation of Photon Arrival Time
Arrival times of X-rays are measured with a scaler in a digital electronics unit for GIS (GIS-E) counting a system clock of the satellite (hereafter a time stamp of the event). Frequency of the system clock depends on a bit rate of telemetry. It is 16384 Hz for high bit rate, 2048 Hz for medium bit rate, and 512 Hz for low bit rate. The clock speeds relating to the measure of photon arrival times are listed in Table 2. Maximum counting rates observable with GIS are also listed in the table.
a) T_tlm in Figure 2.Table 2: Clock speed relating to time assignment of GIS Time Stamp Telemetry Output Maximum Bit Rate Frequency Period Frequency Period^a) Counting Rate^b) ________________________________________________________________________________ High 16384 Hz ~ 61 us 256 Hz ~ 4 ms 256 c/s Medium 2048 Hz ~ 488 us 32 Hz 31.25 ms 32 c/s Low 512 Hz ~ 1.95 ms 4 Hz 125 ms 8 c/s
b) For GIS2 + GIS3.
Time sequence of an X-ray detection by GIS is schematically drawn in figure 2. When an X-ray photon is detected at t_arr, a flag is asserted by the GIS-E. An on-board computer unit (CPU) in the GIS-E detects this flag and starts the on-board data acquisition sequence. The data acquisition takes T_CPU ~ 8ms for one event. After the process the CPU puts a set of data of the event into FIFO (First-In First-Out circuit). In addition, the CPU picks up a set of event data from FIFO and sends it to DP at t_tlm every T_tlm as triggered by the telemetry clock. The event therefore waits in FIFO for a certain time TFIFO. In the case that n events are filled in FIFO when the X-ray event is detected, the event waits for another n * T_tlm before being sent to the DP. The interval T_tlm in figure 2 depends on the bit rate as listed in table 2. T_arr in figure 2 is a time interval between the X-ray detection and the latest telemetry output timing.
The photon arrival time t_arr is estimated from t_tlm with an ambiguity of +/-16m * T_tlm (m is an integer), which corresponds to a time that the time stamp scaler overflows. The ambiguity, however, is long enough for any observation except for those with extremely high counting rates, which causes a significant deadtime of CPU and causes events to wait for much longer than 16 * T_tlm. Hence in the case of observations with no timing bit the ambiguity is negligible and estimated t_arr is accurate enough for temporal analyses.
Figure 2: Time sequence of X-ray detection by GIS. In the figure, t_arr is the X-ray arrival time, t_tlm is the time when a detected X-ray event is output into telemetry, T_tlm is a time interval of telemetry outputs, T_arr is a time interval between an X-ray arrival time and nearest telemetry output, T_CPU is a CPU dead time for the event, and TFIFO is length in time during an X-ray event is waiting for telemetry output in FIFO.
In observations with no timing bit there is no way to estimate t_arr from t_tlm. In temporal analyses t_tlm is used as a photon arrival time instead of t_arr in this case. With simple manipulations, it is clear that t_tlm is delayed against t_arr by a certain time T_delay ranging from (T_CPU + N_FIFO T_tlm) to (T_CPU + (N_FIFO +1) T_tlm), where N_FIFO is the number of events precedently occupying FIFO, depending on T_arr and a total counting rate of the observation. For observations with low counting rates N_FIFO = 0 for most events, then T_delay distributes from T_CPU to (T_CPU + T_tlm) uniformly. As a result T_delay is estimated to be (T_CPU + T_tlm/2) as an average with an uncertainty of T_tlm.
2 Temporal Analysis with No Timing Bit
The results are summarized from investigations on reliability of temporal analysis of the ASCA GIS data obtained with no timing bit in GIS PH mode. This shows the lack of GIS timing bit influences on temporal analyses and the time resolution of the GIS events in PH mode, using PSR B0540-69 data obtained in the PV phase.
2.1 Direct Measurement of T_delay
We deduced T_delay distributes from T_CPU to (T_CPU + T_tlm).
We confirm this estimation by analyzing PSR B0540--69 data obtained in PV
phase. The data only in high bit rate were analyzed for simplicity. Table 3
shows a journal of the observation. Since the number of the timing bits was set
to 10 in the observation, we could know both t_tlm and t_arr precisely within an
accuracy of ~61 us in high bit rate. We know the relationship of T_delay
 t_tlm - t_arr by definition thus we could measure the distribution of T_delay
directly by the observation.
t_tlm - t_arr by definition thus we could measure the distribution of T_delay
directly by the observation.
Observation September 23, 1993 (PV phase)Position (J2000)
= 85.0460,
= --69.3326 Length of Obs. ~ 86 ks (net exposure ~40 ks) Counting rate ~ 2.4 c/s (GIS2), ~ 2.8 c/s (GIS3) Timing bit 10 bit Time resolution ~61 us in high bit rate
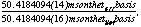
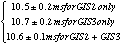
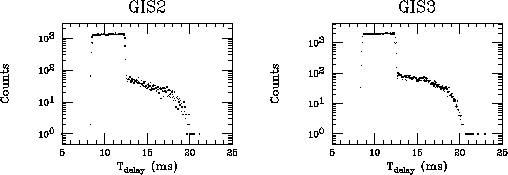
The result is shown in figure 3. The left panel shows GIS2 results and the right panel shows GIS3 results. In both panels more than 90% of the events distribute uniformly between ~ 8 ms to ~ 12 ms, which correspond to T_CPU and (T_CPU + T_tlm) since these were designed so that T_CPU ~ 8 ms and T_tlm ~ 4 ms. The other events have larger T_delay, which correspond to the events waiting to be processed by the CPU in FIFO because the previous event is in FIFO when the event is acquired. Note it is expected that such events with T_delay larger than (T_CPU + T_tlm) increase as counting rates. Since the cutoff near ~ 8 ms is due to the CPU dead time, we derived the CPU dead time in the observation

from the figure. Averaged T_delay was also calculated


from the data. The width of the uniformly distributed part of T_delay was measured to be +/- 3.9 ms.
Figure 3: Distribution of T_delay in milli-second. Left panel shows GIS2 result and right panel shows GIS3 result.
2.2 Folding Analysis with t_tlm
For observations with no timing bit we have to perform temporal analysis on the
basis of t_tlm instead of more accurate event time t_arr. The distribution of
T_delay indicates the temporal analysis results in a pulse profile is smeared
with a scale width of T_tlm ~ 4 ms and shifted in phase by
 with a pulse period unchanged. Below we estimate the difference between
results from folding analysis on the t_tlm basis and those on the t_arr basis by
analyzing the data obtained in the PV phase.
with a pulse period unchanged. Below we estimate the difference between
results from folding analysis on the t_tlm basis and those on the t_arr basis by
analyzing the data obtained in the PV phase.
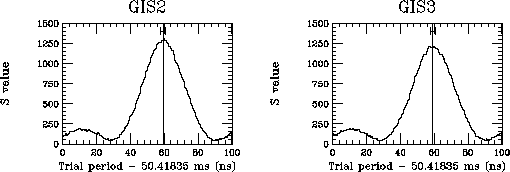
The PSR B0540-69 data was again analyzed for the comparison. Figure 4 shows
the results from
 test (Leahy et al. 1983) to determine pulse period. In the
test the quantity S is computed from the folded light curve as
test (Leahy et al. 1983) to determine pulse period. In the
test the quantity S is computed from the folded light curve as

where j is the number of phase bins in the folded light curve, Ck
is the observed counting rate of the k th phase bin, C is the
averaged counting rate,
 = jC/T , and T is the duration of the observation. We took 50
bins in phase for folded light curves. The peaks seen in the figure correspond
to the pulse period of the pulsar at the observed epoch. By fitting around the
center of the peaks with a Gaussian function, we determined the pulse period
and its error. The errors were estimated so that at the edge of the errors the
model value of the Gaussian function is less than the value at the peak by 1
= jC/T , and T is the duration of the observation. We took 50
bins in phase for folded light curves. The peaks seen in the figure correspond
to the pulse period of the pulsar at the observed epoch. By fitting around the
center of the peaks with a Gaussian function, we determined the pulse period
and its error. The errors were estimated so that at the edge of the errors the
model value of the Gaussian function is less than the value at the peak by 1
 of the
distribution with a degree of freedom
of the
distribution with a degree of freedom
 The periods and errors obtained in this way are

as are compared in the periodgram of figure 4. The periods show excellent agreement as expected.
Figure 4: Periodgram of PSR B0540--69 (GIS2+GIS3) with 50 bins/phase ( it i.e. D.O.F. is 49). Left panel is a result from a folding analysis using t_arr and right panel is that using t_tlm. Vertical lines in both figures indicate best fit periods and errors of the periods are shown on the peaks in the figures.
The folded light curves at the period obtained in the above epoch-foldings are shown in figure 5. Solid lines correspond to folded light curves using t_arr and dashed lines show the folded light curves using t_tlm. An upper panel shows a folded light curve of GIS2 events, a middle shows that of GIS3 events, and bottom shows that of GIS2+GIS3 events. Compared with the folded light curves obtained from folding the data on the basis of t_arr and t_tlm, we can see an apparent phase shift in the pulse profile as expected, while little smearing of the pulse shape are seen. By cross-correlating the light curves, we obtained the pulse delay in phase as
The results coincide with the values of
obtained from the PSR B0540--69 data.
Figure 5: Folded light curve of PSR B0540--69. Solid lines corresponds to folded light curves using t_arr and dashed lines shows folded light curves using t_tlm. An upper panel shows a folded light curve of GIS2 events, a middle shows that of GIS3 events, and bottom shows that of GIS2+GIS3 events.
3 Absolute Time Keeping
We report here calibration status of the ASCATIME against UTC by comparing X-ray pulse arrival times of well-known radio pulsars, the Crab pulsar and PSR B1509--58, with the radio pulse arrival times of the pulsars. The radio observatories continuously monitor these pulsars and provide us precise ephemeris of the pulsars (e.g. Lyne et al. 1994). We can check the ASCATIME by comparing results from the ASCA observations with those from the radio observations in two ways; stability of the ASCATIME is obtained by the comparison of the pulse periods; a constant shift of the ASCATIME against UTC can be calculated by the comparison of the pulse phases. The data obtained in PV phase was used for the check. A journal of the observations are listed in table 4.
_______________________________________________________________________________
Target 				Crab Pulsar		        PSR B1509-58
_______________________________________________________________________________

Date 		April 6, 1993     September 28, 1993	   August 18, 1993

Pulse Period 	  33.415713446 ms  33.422093763 ms       150.77209053165 ms

GIS mode            PH with 10 timing bits / MPC  	PH with 7 timing bits

Bit rate 			High  			    High / Medium

Right Ascension (J2000)	      83.633221 deg          	   228.481779 deg

Declination (J2000)	      22.014461 deg	         	     59.13598 deg
_______________________________________________________________________________
The results from the epoch-folding analysis are shown in figure 6, figure 7, and figure 8. In figure 6 are shown the periodgrams and folded light curves of the Crab pulsar obtained by the observation in April, 1993, and in figure 7 those in September, 1993. Those of PSR B1509--58 are shown in figure 8. In all these figures left panels show periodgrams and folded light curve of GIS2 events and right panels show those of GIS3 events. Vertical lines in the periodgram show the pulse period expected from the radio ephemeris. In the folded light curves the radio pulse peak is referred to the origin of the pulse phase. In the case of the Crab, the X-ray pulse is known to arrive at the same time as the radio pulse in the previous observations. In the case of PSR B1509--58, since it is known there exists the phase shift between the pulse arrival times in the X-ray band and in the radio band (Kawai et al. 1991), the expected pulse arrival times in the X-ray band are indicated by vertical lines in the folded light curves.
Figure 6: Periodgrams and folded light curves of the Crab pulsar observed in April, 1993. Periodgrams and folded light curve of the Crab pulsar observed in April, 1993 for PH mode (upper four panels) and MPC mode (lower four panels). Left panels show periodgrams and folded light curve of GIS2 events and right panels show those of GIS3 events. Vertical lines in the periodgram shows the pulse period expected from the radio ephemeris. In the folded light curves the main peak of the radio pulse is expected to be seen at origin of the pulse phase.
Figure 7: Same as Figure 6 for the observation of the Crab in September, 1993.
From figure 6, figure 7, and figure 8, we can see that the pulse periods
of the pulsars coincide with the periods expected from the radio ephemeris
(Kaspi et al. 1994; Arzoumanian et al 1992; Lyne et al. 1994). Especially,
figure 8 shows that the pulse period of PSR B1509--58 coincides the expected
period within accuracy of the period determination.
 Based on the coincidence, we can evaluate the stability of the ASCATIME by
 or
or

for a timescale of about 1 day, where f is a frequency of the ASCATIME
and  is the difference of the frequency from that of UTC.
Figure 8: Same as figure 6 for the observation of PSR B1509--58. Vertical lines in the folded light curve indicates the expected position of the X-ray pulse (Kawai et al. 1991).
We can also see that figure 6, figure 7, and figure 8 show excellent
agreement in pulse arrival times in both pulsars. From the figures, we
determine the difference between the pulse arrival times as +/- 2 ms
from the Crab data and +/- 3 ms from the PSR B1509--58 data. To determine the
difference between ASCATIME and UTC from these results we have to consider
ambiguity of the pulse periods; the Crab result means the difference is  and the PSR B1509--58 result means the difference is
  , where n is an arbitrary integer, P_crab is the pulse period of the
Crab pulsar, and P1509 the pulse period of PSR B1509--58. By combining the
difference obtained from two pulsars, we reduced the ambiguity and obtained
, where n is an arbitrary integer, P_crab is the pulse period of the
Crab pulsar, and P1509 the pulse period of PSR B1509--58. By combining the
difference obtained from two pulsars, we reduced the ambiguity and obtained

where n is an arbitrary integer again.
4 Summary
Analyzing PSR B0540-69 data with 10 timing bits showed T_delay of more than 90% of observed events distributed uniformly centering around 10.6 ms with 3.9 ms width in high bit rate. As a result, photon arrival times in the data with no timing bit can be interpreted as shifted by 10.6 ms with 3.9 ms jitter. This means, if only relative accuracy in the arrival times is needed (e.g. for the sake of determination of the pulse period), we can expect 3.9 ms of the GIS time resolution in high bit rate for observations with no timing bit. Note that, in other bit rates, the phase shift becomes T_CPU + T_tlm/2 with T_CPU = 8.5 ms independent of the bit rate, and the GIS time resolution reaches down to T_tlm. All of these are in good agreement with those expected from the time assignment system to the ASCA GIS data.
By the epoch-folding analysis of the same data, we confirmed the expected influences of the lack of the GIS timing bit on temporal analyses; phase shift by ~ 10ms in average, little smearing of the pulse shape, and no influence on the determination of the pulse period. For observations with counting rates lower than that of the observation of PSR B0540-69 ~ 2.5 cts/s, the results are expected to remain valid. However, it should noted that this discussion is only valid for observations with low counting rates.
From epoch-folding analyses for the Crab pulsar and PSR B1509--58 observations, we investigated the stability of the ASCATIME and the difference between the ASCATIME and UTC by comparison of the X-ray results with the radio timing results. The stability of the ASCATIME was obtained from the pulse period comparison as

for a timescale of about one day. This is in good agreement with the pre-flight qualification of the stability. The difference between the ASCATIME and UTC was obtained from the pulse phase comparison as
where n is an arbitrary integer. Since it is hard that the time assignment system of ASCA arises errors as much as 300 ms, accuracy in the time assignment of the ASCA data calibrated currently is considered to be +/- 2 ms.
Reference
Arzoumanian, Z., et al. 1992, GRO/radio timing data base, Princeton Univ.
Kaspi, V. M. et al. 1994, GRO/radio timing data base, Princeton Univ.
Kawai, N. et al. 1991, ApJ, 383 , L65.
Leahy, D. A. et al. 1983, ApJ, 266 , 160.
Lyne, A. G. et al. 1994, Jodrell Bank Crab Pulsar Timing Results, Univ. of
Manchester.
 Proceed to the next article
 Return to the previous article
 Select another article