fv Home fv Home
Next: Contour Maps Up: No Title Previous: Header and Data Units Image DisplayRather than viewing the raw numbers in the table spreadsheet, it is usually more informative to display a picture of the image by clicking on the middle `Image' button in the Summary window. On Unix machines, you may be given the option to use the separately available SAOtng image display program, but for now, choose the POW image display option.
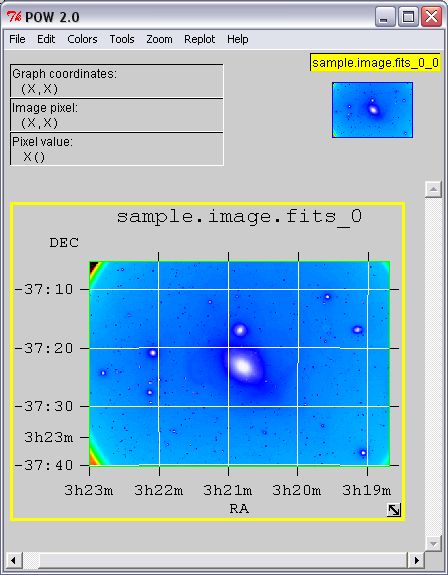
POW is a multi-purpose image display and graphics tool with many features that we can only touch upon here. The POW window (referred to as the POW `canvas') has 2 main frames (Figure 6). The lower frame displays all the images or graphs, and the upper frame displays, on the right, a smaller `scope' window of the currently selected graph, and on the left, a read-out of the current cursor location within the graph. You can change the size of the scope window or turn it off completely under the `Options' menu. We use the term `graph' to refer to any image or plot in the lower part of the POW canvas. Each graph can contain one or more images and/or line graphics plots. The graphs can be interactively resized on the POW canvas by dragging (with the left mouse button) the double-headed arrow icon in the lower right corner of the graph. By default, the aspect ratio of the graph is preserved as it is resized, but you can override this by holding down the shift keyboard key while dragging the image. The graph can be repositioned on the canvas by dragging the label on the upper left corner. After having clicked the `Image' button in the Summary window you should see a single graph on the POW canvas containing an image of the galaxy NGC 1316. A wide variety of alternate color table and intensity scaling options are available under the Colors menu if you don't like the default settings. Finer adjustments to the brightness and contrast in the image can be made by dragging the left mouse button over the image: first position the cursor near the middle of the image (but not over a grid line), hold the left mouse button down and slowly move the mouse up or down to change the contrast of the image. This is easier to visualize if you choose the `gray' color table and enable the `Create Colorbar' option under the Colors menu. Moving the mouse left or right changes the overall brightness of the image. The image is updated almost instantaneously on Unix workstations that use pseudocolor displays, but there is a noticeable delay on Windows machines that use true color imaging mode. The default image contrast and brightness settings can be restored by choosing one of the linear, square root, or logarithmic scaling options under the Colors menu. You can zoom in on a portion of the image by dragging out a rectangle of interest while holding down the right mouse button. The buttons to the right of the scope window will also zoom in or out by factors of 2, and the center `Replot' button restores the default 1:1 zoom factor. One other useful image display feature is that double clicking the left mouse button on the image will cause a table spreadsheet window to pop open, centered on that pixel. This provides a quick way to view the actual data values at any position in the image. Finally, it should be mentioned that the appearance of the grid lines, tick mark labels, and other graph features can be changed under the Options menu or the `Edit Graph' option under the Edit menu.
fv Home
Next: Contour Maps Up: No Title Previous: Header and Data Units Project Scientist: William Pence Project Engineer : Pan Chai July 2008 |