Ximage

Tcl/Tk Device (/xtk)


The recommended interactive device for XIMAGE 4.0 and beyond is the /xtk device. This device provides zoom, recenter, and color adjustment capabilities through a GUI interface.

/xtk device

* Color Capability

By default, 100 colors are allocated to the /xtk device, however, this may be changed through the global Tcl variable, xtkcols, up to a maximum of 255. If you wish to use the maximum number of colors available every time you run ximage (for example, your display is capable of 16-bit or higher), edit your ~/.ximagerc file to contain the line: set xtkcols 255. This variable may also be set while executing ximage, however, if the /xtk device is already in use, the setting will not take effect until it is closed and plotted to again.

Ximage reserves color indices 0-15 as default colors which remain unchanged regardless of the current color table. Indices from 16 up to the color capability of the device are available for image display. The number of color levels is determined by the number of levels set with the levels/num= command (16 by default). The number of colors used in image plotting is one more than the number of levels, hence the maximum number of levels that may be used with the /xtk device is 238 (i.e. levels/num=238), although levels divisible by 4 are recommended, such 16, 64, 216, etc. as the scale command is better suited for such values.

* Device Size

By default, the size of the plot area in the /xtk device is 760x576, however, the width may be changed through global Tcl variable, xtkwid, and the height may be changed through xtkhgt. It is best to preserve the same aspect ratio when changing sizes, otherwise some viewport settings will have unwanted spacing. If the /xtk device is already in use, size changes will not take effect until it is closed and plotted to again.

* Plot Area

The plot area is where the images, contours, etc appear in the /xtk device. The size of the plot area is fixed, however, if the window's size is adjusted smaller, the visible portion of the plot decreases. The scroll bars may be used to adjust which portion of the plot area is visible.

/xtk plot area

The following actions are defined in the plot area:

  • Left-click: plot zooms in by factor of 2 and recenters
  • Middle-click: plot recenters at clicked point (Zoom remains same)
  • Right-click: plot zooms out by factor of 2 and recenters
Note, if an interactive command is executed, such as centroid/cursor, these actions are suspended until the command is finished requesting mouse input.

* Coordinate Info

Mousing over the plot area updates coordinate information, including sky (RA/Dec), galactic, detector and image coordinates as well as the value of the pixel at that location.

/xtk coordinate info

* Zoom

To perform plot zooming without changing the center, use the Zoom buttons.

/xtk zoom buttons
  • The "Zoom In" button zooms in by factor of 2
  • The "Replot" button resets the image to the original zoom of 1
  • The "Zoom Out" button zooms out by factor of 2
  • The "Zoom:" field below these buttons reflects the current zoom factor

* Viewport Switching

When viewports are defined (e.g. viewport 3x2 for the pictured example), all actions, such as displaying coordinate information and zooming, apply to the current image, which is the last plotted image by default. The current viewport, however, may be changed by using the viewport selector:

/xtk viewport selector

A box is drawn representing each plotted viewport, numbered for the order defined in the viewport file. The viewport highlighted in blue is the current viewport, to which mouseover coordinates, zooming, etc. apply. The current viewport may be changed by clicking inside the viewport as it is represented in the viewport selector. Note: the position where the next viewport will be displayed is not affected by the viewport selector.

* Color Table Adjustment

Use the sliders to adjust the color table that is currently being displayed. Clicking the left button on either side of a slider, increments the value by the smallest division in that direction. Left-clicking and holding allows you to drag the slider to the desired value, while interim values are plotted. Middle-clicking on any value makes the slider jump to that position without plotting the effects of any interim values.

/xtk color table adjustment

The "Brightness" slider adjusts the brightness of displayed color table. The default is 0.5 with available values ranging from 0.0 to 1.0. If a scale is displayed, the colors will appear to shift to the right as brightness decreases, and the colors will shift to the left as brightness increases.

The "Contrast" slider adjusts the contrast of displayed color table. The default is 1.0 with available values ranging from 0.0 to 4.0. If a scale is displayed, the colors will appear to compress for higher contrast values (bright spots get brighter and dark spots get darker) and spread out for lower contrast values.

The "Reset" button returns the brightness to the default value of 0.5, and the contrast to the default value of 1.0.

Note: depending on the color capability of your display, the adjustment of color tables will have a slightly different behavior. For 8-bit PseudoColor displays, all color adjustments will be virtually instantaneous, as you drag the slider. For more color-capable TrueColor displays, changing the colors requires a redraw, so there is a slight delay between changes. It is not recommended that you drag the slider in this case, but rather jump to a specific contrast or brightness setting by clicking the middle button on the desired value.

* Missing Data

The /xtk device is unique from all other devices as it can zoom images and contours already displayed, while retaining labels, boxes, etc. that are on the image. The device is actually keeping track of everything as it is plotted. Image maps, however, are usually quite large, so all that is remembered is the mapid (e.g. MAP1, EXMAP1). When a displayed map is freed, moved, or another map is read into its place, the /xtk device cannot perform any action which requires access to the original map, such as retrieving mouseover coordinate information and zooming. If you attempt to perform such an action, an error will be displayed: "Original map data is unavailable". In special cases where some maps are available and some are not, a warning is presented:

/xtk missing data dialog

The safest option is "Cancel" which leaves the plot untouched. If you are sure you wish to redraw the image, however, "OK" will go ahead and plot all the images that are still available, omitting those that are not. Note: if you are using multiple viewports the order will also change to fill in where the missing images were. In general, the "OK" option is not recommended. To avoid this situation, ensure that all the image maps you wish to plot on one screen are loaded in the available slots (MAP1-9).

Note that there is a special feature implemented in ximage which attempts to improve the missing data situation. When an image map is copied with the map copy command, a linkage between the two maps is created, which recognizes them as exact duplicates. If a map that has been plotted is overwritten or modified through a command such as smooth, further replots that need the original map will be able to refer to an unaltered copy if one exists in any other map slot.

* "File" Menu

The "File" menu contains two options for recording the plot area, "Print..." and "Screen Grab..." The Print option switches to a PostScript or GIF device and redraws everything.

/xtk print dialog

In the "Print" window, there are three output options:

  • Printer - Writes to pgplot.ps and uses the entered "Print Command:" to send it to the printer
  • PS File - Writes to PostScript file entered in "PS File:" field" (Default: pgplot.ps)
  • GIF File - Writes to GIF file entered in "GIF File:" field" (Default: pgplot.gif)
The orientation of the output file defaults to "Landscape" as this matches the aspect ratio of the plot area. The "Portrait" orientation inverts the width and height of the plot area. Combining the "Portrait" mode with multiple viewports may cause unwanted spacing to appear between the viewports.

By default the output file is drawn using "Color" as the plot area of the /xtk device is in color, however, when printing to paper white on black color tables are not optimal. Clicking on the "Greyscale" option switches to the invgray color table, and temporarily changes the /xtk device to that color table for a preview.

Press the "Print" button to initiate writing to a file and printing, if applicable. Note: the /xtk device will not be able to update until the operation is complete. To exit the "Print" window without doing anything, press "Cancel"

If, however, all data is not available for items in the plotted area, the "Print..." option will be unable to reproduce the plot as it appears. In this case, the "Screen Grab..." option is recommended.

/xtk screengrab dialog

There are two methods for performing the screen grab, "xv" and "ImageMagick convert". The default, "xv", raises the /xtk device and uses xv to crop the plot area. You must save the image from xv or it will be lost.

  • Right-click the cropped image
  • From "xv controls" click the "Save" button
  • Enter the file name in the "Save file:" field (e.g. pgplot.gif)
  • Press "OK"
The uncropped grab, pgplot.xwd, will remain in your directory unless removed manually.

The "ImageMagick convert" method requires ImageMagick to be installed, however, it is much more automatic than the "xv" method. When this method is selected the "Image file:" field becomes available for editing. The filename entered in this field, which is pgplot.gif by default, determines the type of the converted file by its extension. GIFs are recommended. The uncropped grab, pgplot.xwd, is deleted automatically after the output file is written.

The "File" menu also contains a "Close" option which closes the /xtk device. This is equivalent to using the close_pg_window command.
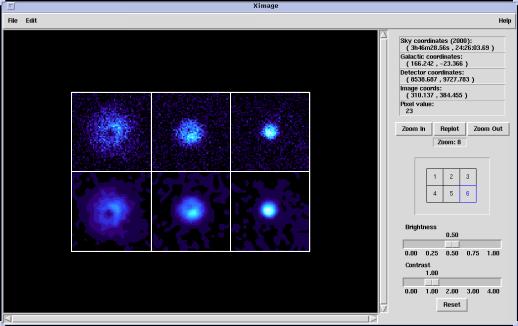
* "Edit" Menu

The "Edit" menu contains quick access to a couple commonly used ximage commands, grid, which overlays a grid of sky coordinates on the image, and scale, which plots a legend representing the values assigned to each color in the image.

/xtk edit menu

The difference is that "Show Grid" and "Show Scale" are checkboxes which allow these annotations to the plots to be turned on and off without redisplaying the image.

* "Help" Menu

Selecting "Ximage" from the "Help" menu is a simple way to connect to the latest online help for ximage, provided Netscape is running.

/xtk help dialog

Click "OK" to send a current Netscape browser to the main ximage page. Selecting "Cancel" will close the window with no effect.


Ximage Home Page Xanadu Home Page Xanadu ftp site

Please send reports of errors to : xanprob@athena.gsfc.nasa.gov
HEASARC Home | Observatories | Archive | Calibration | Software | Tools | Students/Teachers/Public

Last modified: Wednesday, 29-Mar-2006 14:44:33 EST