Come analyze HEASARC, IRSA, and MAST data in the cloud! The Fornax Initiative is now welcoming all interested beta users.
Spectropolarimetry Example
XSPEC can fit spectropolarimetric models to spectra for the I, Q, and U Stokes parameters. The following is a toy example for IXPE data. The responses are notional and should not be used with actual data.
XSPEC12> data 1:1 toy_point_source_du1_pha1.fits
XSPEC12> data 1:2 toy_point_source_du1_pha1q.fits
XSPEC12> data 1:3 toy_point_source_du1_pha1u.fits
XSPEC12> data 2:4 toy_point_source_du2_pha1.fits
XSPEC12> data 2:5 toy_point_source_du2_pha1u.fits
XSPEC12> data 2:6 toy_point_source_du2_pha1q.fits
XSPEC12> ignore 1-6:0.0-2.0 8.0-**
This has read in the I, Q, U triplet for two of the three telescopes and placed each triplet in its own data group. The I, Q, and U spectra are distinguished by having different values of their XFLT0001 keyword: 'Stokes:0', 'Stokes:1', and 'Stokes:2' for I, Q, and U respectively.
XSPEC12>model polconst*powerlaw
...
========================================================================
Model polconst<1>*powerlaw<2> Source No.: 1   Active/On
Model Model Component  Parameter  Unit     Value
par  comp
                        Data group: 1
1    1   polconst   A                   1.00000      +/-  0.0
2    1   polconst   psi        deg      45.0000      +/-  0.0
3    2   powerlaw   PhoIndex            1.00000      +/-  0.0
4    2   powerlaw   norm                1.00000      +/-  0.0
                        Data group: 2
5    1   polconst   A                   1.00000      = p1
6    1   polconst   psi        deg      45.0000      = p2
7    2   powerlaw   PhoIndex            1.00000      = p3
8    2   powerlaw   norm                1.00000      = p4
________________________________________________________________________
defines a power-law model with constant polarization fraction and angle.
XSPEC12> fit
...
========================================================================
Model polconst<1>*powerlaw<2> Source No.: 1   Active/On
Model Model Component  Parameter  Unit     Value
par  comp
                        Data group: 1
1    1   polconst   A                   0.498573     +/-  1.12218E-03
2    1   polconst   psi        deg      29.9835      +/-  6.40758E-02
3    2   powerlaw   PhoIndex            1.99757      +/-  9.75912E-04
4    2   powerlaw   norm                9.96930      +/-  1.13268E-02
                        Data group: 2
5    1   polconst   A                   0.49857      = p1
6    1   polconst   psi        deg      29.983       = p2
7    2   powerlaw   PhoIndex            1.99757      = p3
8    2   powerlaw   norm                9.96930      = p4
________________________________________________________________________


Fit statistic  : Chi-Squared                  175.42     using 149 bins.
                 Chi-Squared                  107.92     using 149 bins.
                 Chi-Squared                  165.08     using 149 bins.
                 Chi-Squared                  168.22     using 149 bins.
                 Chi-Squared                  133.51     using 149 bins.
                 Chi-Squared                  144.68     using 149 bins.
Total fit statistic                           894.82     with 890 d.o.f.

Test statistic : Chi-Squared                  894.82     using 894 bins.
 Null hypothesis probability of 4.48e-01 with 890 degrees of freedom
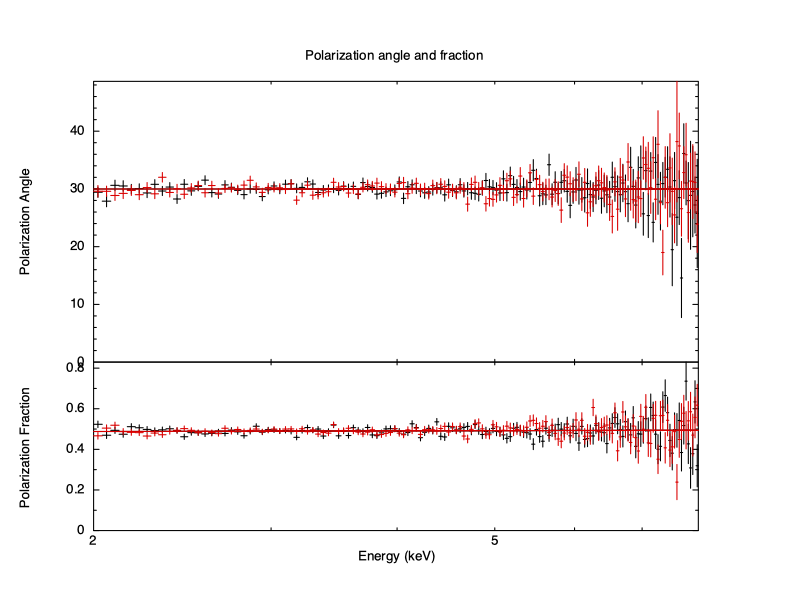
Plotting the data shows the data and model for each individual spectrum as usual but for spectropolarimetry there is an additional plot option to show the derived polarization angle and fraction for both the data and the model as calculated from the Stokes parameters.
XSPEC12> plot polangle polfrac