Next: References Up: XRISM POG Previous: 7. Observations of Extended Contents
Bright sources, here defined as those that produce
 ph s
ph s in the Resolve bandpass, are important XRISM targets because the high count rate enables precise measurements of variability in emission and absorption lines, as well as detecting weak features at high significance. The X-ray flux that produces a count rate exceeding 100 ph s depends on the spectrum, with softer spectra producing greater count rates at a fixed energy, but as a rule of thumb this chapter applies to source fluxes exceeding
  keV
keV
 erg s cm
 . This flux is equivalent to about 500 mCrab, where the Crab Nebula X-ray flux is defined as
  keV
keV
 erg s cm (Willingale et al., 2001). Almost all persistent “bright” sources are well-known Galactic compact objects (see https://heasarc.gsfc.nasa.gov/docs/heasarc/headates/brightest.html).
Above this flux, the number of source events (especially high-resolution events) no longer depends linearly on the source flux and exposure time. High count rates can saturate pixels with low-resolution events, saturate the onboard event processor entirely, and degrade the energy resolution due to electrical cross-talk (Mizumoto et al. , 2022). The net impact is fewer clean, high-resolution events than expected for the exposure time. In this chapter, we briefly introduce the challenges posed by very bright sources, then describe observing strategies to maximize the high-resolution event rate, and conclude with general advice on proposing and analyzing such sources. Since the Crab Nebula is the only current extended source with a count rate that falls in this regime, observing strategies assume point-like sources.
Any source that can produce
counts s in Resolve will be extremely piled-up in Xtend, for which a “bright” source is about thirty times dimmer ( keV
 erg s cm). Chapter 6 describes the impact of high count rates on event detection (pile-up and out-of-time events) and the observing modes available to mitigate issues. For almost any bright source, the optimal Xtend observing mode is a windowed burst mode.
Observers should try to maximize the high-resolution yield, which we denote as Hp+Mp following the convention of Section 5.3.3 (high-resolution and primary medium-resolution events). Section 5.3 describes how events are detected. Section 5.3.3 describes how the Hp+Mp yield depends on total incident count rate in a single pixel based on the characteristic time delay between photons: Hp+Mp increases with total rate up to a maximum and then decreases as the average time delay between arriving photons becomes shorter than the length of the high-resolution optimal filtering template. However, as almost all “bright” sources are point-like, we must also consider the illumination pattern of the Resolve array by the PSF. The total array Hp+Mp rate,
 , depends on the total source flux, the shape of the PSF and pointing center relative to the center of the Resolve array, and the source spectrum.
reaches a maximum of
, depends on the total source flux, the shape of the PSF and pointing center relative to the center of the Resolve array, and the source spectrum.
reaches a maximum of  100 counts s for an on-axis point source with a Hitomi-like PSF (half-power diameter of 1.2
 ) at a total incident rate of 1000 counts s on the array.
The Pulse Shape Processor (PSP) cannot process 1000 count s; its limit is about 200 count s for an on-axis source, assuming that all events processed by the PSP are original source counts (i.e., background events further reduce this). Events beyond this limit are discarded and therefore “lost.” The PSP processes events by drawing the next event from a list provided from the event-finding board (a field-programmable gate array, or FPGA). The packet of information from this list includes the addresses of the stored pulse data, so the PSP retrieves the pulse from the buffer and cross-correlates it with a template as described above. The processing time depends on the template length. When processing is complete, the event data is discarded and the energy, arrival time, etc. are sent to the data recorder. If the data buffer fills up before the PSP has processed all waiting events, the entire buffer is cleared and begins to fill up from zero. Hence, at high count rates the PSP can be overwhelmed and events can be lost (but see below).
The PSP houses four CPUs, one for each quadrant of the 36-pixel Resolve array. Each CPU runs an event-processing application for each of 9 pixels so that more than one event can be processed simultaneously. This means that event loss in one quadrant does not necessarily imply event loss in other quadrants, which we will use to our advantage in observing bright sources. When an event from a given pixel is processed, the default behavior of each CPU is to put that pixel in the back of the line and start processing events from the next available pixel. However, because different event grades take different processing times, a pixel with many low-resolution events can get a higher fraction of its event buffer processed than one with mostly high-resolution events. Averaged over the array, high-resolution events can be preferentially lost.
Resolve does not “pile up” in the same way as CCD imaging spectrometers, but an analogous effect can occur for two events that arrive at almost exactly the same time. When two events are separated by less than a few ms, the secondary event-finding process in the PSP can fail and treat the two events as a single event, thereby misreporting the energy. Several percent of the events can be affected (Mizumoto et al. , 2022), with a concurrent loss of several percent of the exposure time after screening.
Finally, it is important to note that the event-finding algorithm on the FPGA that creates the lists and fills data buffers for the PSP sends information about the number of lost events to the data recorder, so not all information is lost when there is a buffer overflow. The FPGA will not be overwhelmed for almost any conceivable X-ray flux and this information can be used to reconstruct source fluxes (since whether an event is lost or not, or whether it is high resolution or not, does not depend on photon energy). However, without the search for secondary events performed by the PSP, the FPGA count rate is a lower limit.
In addition to event grading and event loss, a third challenge in the high-count-rate regime is electrical cross-talk (Section 5.3.6). Voltage (“parent”) pulses in the wire from one pixel induce “child” pulses in neighboring wires (thermal cross-talk is an order of magnitude weaker and unimportant). Child pulses have an amplitude 0.6% that of the parent for immediately neighboring wires and  0.1% for next-nearest wires. Due to the wiring map of the array, child pulses are not necessarily induced in physically adjacent pixels (Figure 8.1). Most pixels produce two child pulses per parent, and a few produce only one.
Because of their small amplitude, child pulses are rarely, if ever, detected as events in their own right. However, child pulses make the signal noisier and can lead to significant errors in the energy measured by optimal filtering if they occur at the same time as a real event. Such unhappy coincidences increase with count rate, so cross-talk can degrade the energy resolution of the Hp+Mp spectrum for bright sources. This degradation varies from pixel to pixel, so the total-array degradation is a weighted average. Under ordinary circumstances, cross-talk contamination can be eliminated by ignoring events in electrically neighboring pixels that occur within a few ms of each other. However, for very bright sources the fraction of events that occur within a few ms of each other may be quite high. Strict filtering can eliminate many Hp+Mp events, making the cure worse than the disease.
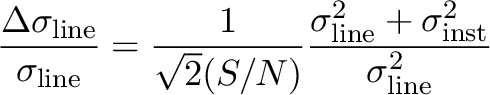
The impact of cross-talk on scientific analysis depends on the spectrum and the goal. A hard spectrum at a very high count rate will produce child pulses with larger average amplitudes than a soft spectrum at the same rate, leading to larger errors on the energy. Likewise, if a line of interest falls at 1 keV the fractional error in the velocity resolution will be worse than at 6 keV. The effect can be calculated exactly as a function of count rate for a monochromatic source, but for a more physically motivated spectrum we must calculate it statistically. Figure 8.2 shows the impact of cross-talk for a 4 Crab (2-10 keV
 erg s cm), on-axis point source with a Crab-like spectrum with no filters. The left panel shows the broadening and centroid shift resulting from increased cross-talk contamination for an example Fe K
 line. The right panel shows the average energy resolution (starting from a fiducial 5 eV resolution) in each pixel for this source (note that the most strongly affected pixels are at the array edge but are electrical neighbors of the central four). More examples of the impact of cross-talk on energy resolution are given for simulated spectra in Mizumoto et al. (2022).
Finally, it is worth noting that in bursty sources (i.e., those with sharp variations within a single observation) the spectral resolution may degrade during a particularly bright burst. Observers interpreting line shifts and broadening during a burst must account for cross-talk.
Note: The estimates of cross-talk presented here are based on a representative pair of pixels from the Hitomi Soft X-ray Spectrometer. Cross-talk impact can be non-uniform, as it depends on the size of the parent pulse in volts per eV, the strength of the coupling, the interaction of the cross-talk pulse shape with the unique digital filter of the parent pixel, and the gain scale of the parent pixel. As noted above, the incident spectrum also makes a difference.
![\begin{figure}\centering
\includegraphics[width=1\textwidth]{Figures_Bright_Source/crosstalk1.pdf}
\end{figure}](img149.gif) |
![\begin{figure}\centering
\includegraphics[width=1\textwidth]{Figures_Bright_Source/crosstalk2_gvc.pdf}
\end{figure}](img150.gif) |
Degradation of energy resolution due to electrical cross-talk becomes important above 0.3-10 keV
 erg s cm. Event loss starts to become important above
 erg s cm. Above these thresholds, maximizing the “clean” Hp+Mp rate (i.e., from pixels where the average cross-talk degradation is no more than 2% the native energy resolution) is achieved by reducing the incident count rate from the default, on-axis value. This can be achieved by using a filter to reduce the effective area (see curves in Figure 8.3) and/or pointing off-axis. The Be filter removes most of the photons below 2 keV and is not useful in the current configuration, while the neutral-density (ND) filter reduces the count rate at every energy by a factor of about four.
Pointing off-axis causes more focused X-rays to fall off the chip and can also be used to concentrate low-resolution events and their attendant cross-talk signals in one sacrificial quadrant, thereby maximizing the clean Hp+Mp rate in the other quadrants. Figure 8.4 shows the results for a Crab-like point source located at the quadrant opposite the calibration pixel. The upper right quadrant is saturated by low resolution events and contributes about 10% of the Hp+Mp events, which also have average energy resolutions degraded by 0.1-2.5 eV. However, the other three quadrants produce about 55 counts s with an energy resolution within 0.1 eV of the fiducial 5 eV value. The count rates in the other quadrants are also low enough that a crosstalk exclusion filter ( 25 ms) can be applied with little or no impact on the number of Hp+Mp events, but such filtering should not be necessary. Note: The structure of the PSF wings, based on a ray trace incorporating ground measurements, is not yet fully known, especially as a function of off-axis angle. Figure 8.4 thus does not have very high fidelity and is shown as an example. Observers should also bear in mind the effects of roll angle.
Table 8.1 illustrates how the optimal configuration (in bold) changes with increasing count rate for a sample spectrum from a point source. The Be filter is omitted as makes hardly any difference over the gate valve itself (a much thicker Be filter). For sources brighter than about 3 Crab, the ND filter becomes optimal; at 10 Crab off-axis pointing also becomes important.
| Flux | No filter | ND Filter | ND+Off-axis | ||||||
(0.3-10 keV  |
Total | Hp+Mp | Clean | Total | Hp+Mp | Clean | Total | Hp+Mp | Clean |
|
erg s cm) |
(ph s) |
(ph s) |
(ph s) |
||||||
| 0.5 | 35 | 30 | 15 | 10 | 10 | 5 | 10 | 10 | 5 |
| 1.0 | 70 | 45 | 30 | 20 | 15 | 5 | 20 | 15 | 10 |
| 2.0 | 140 | 60 | 50 | 30 | 30 | 15 | 30 | 25 | 20 |
| 3.0 | 210 | 70 | 50 | 50 | 35 | 15 | 50 | 35 | 25 |
| 4.0 | 280 | 70 | 50 | 70 | 45 | 30 | 60 | 40 | 25 |
| 5.0 | 350 | 80 | 45 | 90 | 50 | 30 | 80 | 40 | 30 |
| 6.0 | 420 | 85 | 40 | 100 | 50 | 45 | 100 | 40 | 25 |
| 7.0 | 490 | 85 | 30 | 120 | 60 | 45 | 110 | 50 | 25 |
| 8.0 | 560 | 80 | 25 | 140 | 60 | 45 | 130 | 50 | 25 |
| 9.0 | 630 | 80 | 25 | 160 | 65 | 50 | 150 | 50 | 25 |
| 10. | 700 | 80 | 10 | 170 | 70 | 55 | 160 | 50 | 30 |
| 20. | 1410 | 70 | 1 | 340 | 80 | 40 | 330 | 65 | 30 |
| 50. | 3520 | 30 | 0 | 860 | 80 | 5 | 810 | 65 | 35 |
All values assume an on-axis source except for the “off-axis” set at a fiducial offset of  0.5 arcmin offset in both RA and Dec. “Clean” events are those H+Mp events whose average energy resolution is within 2% of a fiducial 5 eV resolution. Bold text indicates the optimal rate and thus observing configuration. The input spectrum is a 0.5 arcmin offset in both RA and Dec. “Clean” events are those H+Mp events whose average energy resolution is within 2% of a fiducial 5 eV resolution. Bold text indicates the optimal rate and thus observing configuration. The input spectrum is a  power law with photoelectric absorption from power law with photoelectric absorption from  cm of foreground atomic gas. Exact values are sensitive to the spectrum, structure in the PSF wings, etc. This table is for illustration only. cm of foreground atomic gas. Exact values are sensitive to the spectrum, structure in the PSF wings, etc. This table is for illustration only.
|
|||||||||
While this table is for the purpose of illustration (adopting a modestly absorbed power law spectrum), it reveals the basic strategy: first try a filter, then point off axis towards the corner of one quadrant. We do not recommend using the quadrant with the dummy pixel, as the CPU for that quadrant must process the  Fe calibration source photons that are necessary for gain tracking. We have summarized general recommendations as a function of source brightness in Table 8.2. Here we offer a few additional comments for proposers:
First, proposers should use the effective area curves (encoded in the ARFs) to estimate the count rates for different filters (e.g., via WebPIMMS: https://heasarc.gsfc.nasa.gov/cgi-bin/Tools/w3pimms/w3pimms.pl). On-axis, point-source ARFs are sufficient for this purpose when proposing; there is a small ( %) decline in effective area for off-axis pointing due to vignetting, but this is not sufficient to change the optimal strategy. Observers should also be aware of the impact of uncertainty in the spectral shape on the expected count rate and the uncertainty in the PSF wings to the Resolve illumination pattern for the off-axis pointing. Note that values quoted here are based on the PSP algorithm, measurements from Hitomi on the time needed to process events of each grade, measurements of the cross-talk contamination, and ground calibration measurements of the PSF and the energy resolution. As more on-orbit XRISM measurements are made, the model will be updated in future cycles.
Secondly, proposers should estimate the sensitivity of their scientific goals to small changes in energy resolution. We defined clean Hp+Mp events as those originating in pixels with average energy resolution within 2% of the native resolution (i.e., 5.1 eV for a native 5 eV). This would make the cross-talk degradation smaller than the calibration uncertainty to the point where it could essentially be ignored. Proposals that are not focused on fine line structures or that can accept greater velocity uncertainty may maximize the total Hp+Mp rate rather than the “clean” rate. The clean rate cannot be estimated from the ARFs alone but requires knowing the expected count rate in each pixel (e.g., from heasim), so that one can make an estimate of the cross-talk rate in each pixel, and also the incident spectrum, so that one can estimate the energy degradation for a line of interest. A tool to estimate the impact of cross-talk for an input spectrum will be made available at https://heasarc.gsfc.nasa.gov/docs/xrism/proposals/index.html, but it is not necessary: Table 8.1 can be used as a guide for proposing to maximize the total Hp+Mp rate or the clean Hp+Mp rate.
![\includegraphics[width=0.6\textwidth]{Figures_Resolve/resolve_effective_area_filters_xlog_CVC.pdf}](img157.gif)
|
![\begin{figure}\centering
\includegraphics[width=0.95\textwidth]{Figures_Bright_Source/offaxis_gvc.pdf}
\end{figure}](img158.gif) |
Once the data are in hand, the main objective is to maximize the clean Hp+Mp counts. The definition of “clean” very much depends on the science goal: extracting a spectrum from the entire array makes sense for maximizing the signal-to-noise ratio ( ) in a short time frame, while detailed velocity measurements using an Fe XXVI absorption line may require selecting events only from pixels largely unaffected by cross-talk. We defined clean above as 2% of the native energy resolution (i.e., 5.1 eV for a 5.0 eV native resolution), which is well within the calibration uncertainty, but observers can estimate the cross-talk impact from the data themselves and adopt their own definition of clean.
The simplest way to eliminate cross-talk contamination is to exclude 25 ms from each pulse in each electrically neighboring pixel, which can be captured via a good-time interval file. This exclusion window is in the CALDB and, while not automatically executed in the pipeline processing, can be implemented with the XRISM software tools. The impact on the effective exposure time is a strong function of pixel, since the pixels near the core of the PSF will have by far the highest count rates, and their electrically neighboring pixels are not only the ones physically adjacent on the detector. If this removes too many events, the next simplest approach is to use the count rate per pixel to determine which electrically neighboring pixels will be most affected by cross-talk degradation and omit those pixels from a combined spectrum. This can be predicted as a function of count rate, position, and a rough idea of the spectrum, as shown in Figures 8.2 and 8.4. For these purposes, the MXS can be treated as part of the same source as it will be affected by cross-talk filtering.
We note that these predictions carry inherent uncertainty of about 1-2% of the native energy resolution. This is because only a small fraction of cross-talk pulses significantly affect the energy measurement (those that occur near the peak of a real pulse), and the magnitude of the error also depends on the relative energy of the real pulse and the cross-talk parent pulse. Since photon arrival is a Poisson process, any given observation will deviate from the average a small amount.
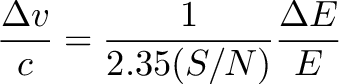
To determine the importance of cross-talk contamination, consider that line centroids can be measured to a precision
 |
(8.1) |
line at 6.4 keV, and  , one can measure
  to 10 km s. Degrading the resolution to 6 eV would lead to a constraint of 12 km s. Line broadening can be determined to a precision
 |
(8.2) |
 is needed to measure
 to 30% precision. At 6 eV,
 is needed to make the same measurement. It is also important to consider the limiting precision on a prospective measurement from systematic calibration uncertainty, such as gain differences between pixels, which effectively degrades the energy resolution.
The optimal combination of offset pointing and/or filter depends on the source type and science goals. Here we provide basic guidelines for observing point sources of various fluxes with the goal of characterizing Fe K emission or absorption above 6 keV in a source otherwise characterized by an absorbed power law.
| Flux | Recommendation | Clean Rate |
|
(0.3-10 keV erg s cm) |
(ph s) |
|
| 0.5-1 | On axis, no filter | 20-30 |
| 1-3 | On-axis, no filter | 40-55 |
| 3-10 | On-axis, ND | 40-60 |
| 10-30 | On-axis (0-0.5), ND |
40-50 |
| 50 | Off-axis (1.0), ND |
30 |
“Clean” events are those H+Mp events whose average energy resolution is within 2% of the fiducial 5 eV resolution. The input source is a point source with a a power law spectrum with photoelectric absorption from cm of foreground atomic gas. Exact values are sensitive to the spectrum, structure in the PSF wings, and off-axis position. At all fluxes, the appropriate Xtend mode is 1/8 windowburst, as the source always produces  500 counts s. 500 counts s.
|
||

