What Residuals Plot Should I Use?Return to: Analysis Threads | Analysis Main Page
OverviewWhen performing spectral analysis with XSPEC, you have a choice of how to display your residuals. This analysis thread recommends that for NICER data you should always use "plot ratio" for residuals and not "delchi" or "resid". Read this thread if you want to: Understand why you should use "plot ratio" Last update: 2021-07-23 IntroductionWhen performing spectral analysis with the XSPEC spectral analysis package, one has a choice in how to display residuals. This thread recommends a certain set of practices for most NICER data, unless you have a compelling reason to do otherwise. Why does it matter? Displaying inaccurate or erroneous residuals can be used to mislead the reader of a scientific report, or to hide or overemphasize certain features. Best practice is to appropriately assign uncertainties so that the reader has a fair picture of your scientific results. Displaying accurate residuals is part of this practice. For other discussions of calibration best practices, please see the NICER Calibration Recommendations analysis thread. Recommended PracticeThe NICER team recommends to use "plot ratio" for all residual plots. This will represent the fairest interpretation of systematic errors. Are All NICER Spectra Systematics Dominated?Are all NICER spectra systematics dominated? It's difficult to make a blanket statement for all possible combinations of NICER analysis, but generally, yes, one can assume that most NICER spectra are systematics dominated. For bright targets (>100 ct/s observed in ~1000 seconds), systematic errors are dominated by the response matrix (~1% in the 0.4-10 keV band). As noted on the NICER Calibration Recommendations analysis thread, one cannot achieve better than the spectral response systematic limit. For faint targets, systematic errors are dominated by inaccuracies of the background model subtraction, which can be ~5% or more. Thus, regardless of source type, most NICER spectra are dominated by systematics, and not statistics. What About the XSPEC Systematics Command?XSPEC does have a a "systematic" command that allows a scientist to assign systematic errors to the actual spectral fitting analysis, and not just for residuals display. For bright targets, use of the "systematic" command also de-emphasizes the portions of the spectrum which are highest count rate, which are typically most systematics-dominated. The NICER team does recommend to use the systematics command in addition to using "plot ratio". Please see the NICER Calibration Recommendations analysis thread for further recommendations. ExamplesHere are some examples from NICER observations of the Crab Nebula, which were used for calibration purposes. Plot Residuals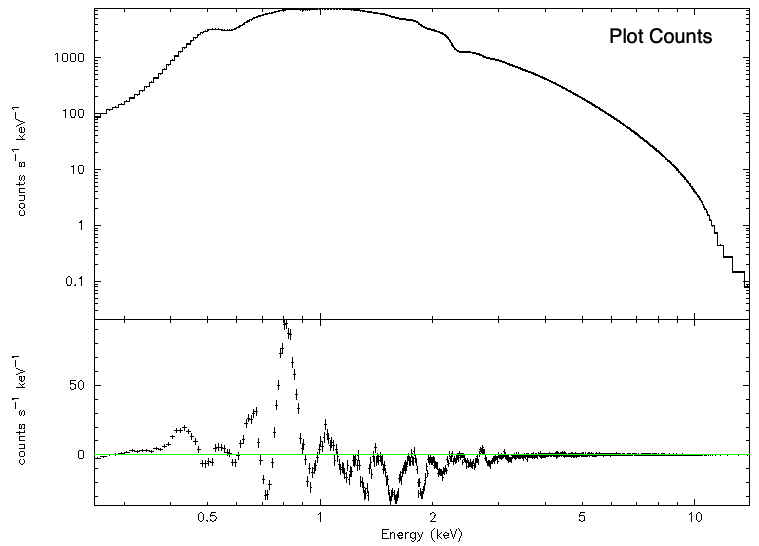 Figure 1. Results of "plot resid". Figure 1 shows the results of "plot resid". Plotting raw counts residuals is never recommended for presenting spectral analysis results.. It does not take into account any form of error bars and thus overemphasizes both systematics and counts differences. Plot "Delchi"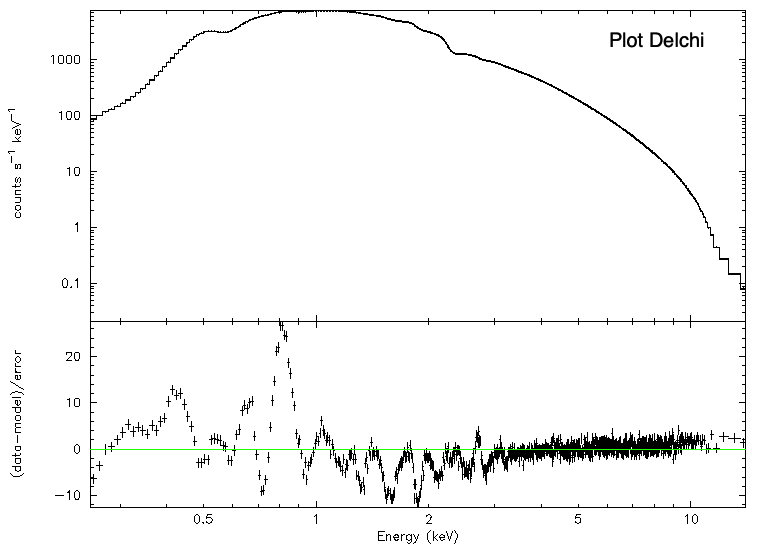 Figure 2. Results of "plot delchi". Figure 2 shows the results of "plot delchi", also known as residuals normalized by the statistical errors, (data-model)/error. In this case we have set "systematic 0" so that error bars are purely statistical. Plotting normalized residuals is slightly better in this case, but still over-emphasizes features that are not necessarily astrophysical. Residuals of >20 sigma may normally be considered extreme, and reason to reject a spectral fit, but these residuals do not tell the whole store when the spectrum is systematics-dominated. Plot Ratio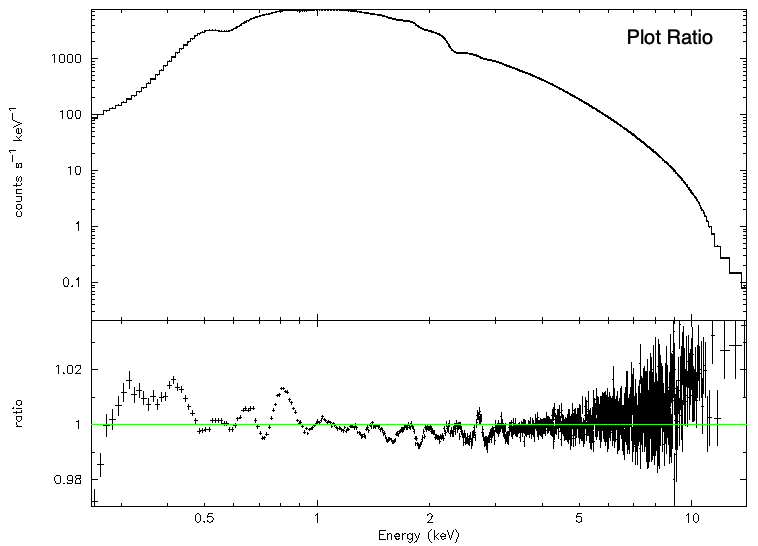 Figure 3. Results of "plot ratio". Figure 3 shows the results of "plot ratio", which is computed as data/model. In this case we can see that the "strong" features that showed up in the delchi plot are actually within 1-2% of the model. Since the systematics limit of the response matrix is ~1%, they are not truly significant. What Should I Do When I Reach the Systematics Limit?The short answer is, stop when you reach the systematics limit. No matter how tempting it may be to change the spectral model (add components or add more complicated models), there is no statistical need for these additions when you reach the systematics limit. You are done! Modifications
|


- HEASARC Director: Vacant
- NASA Official: Ryan Smallcomb
- Web Curator: J.D. Myers
- Last Modified: 23-Jul-2021