(OBSOLETE) Creating NICER Spectra with XSELECTReturn to: Analysis Threads | Analysis Main Page
OverviewThis tutorial illustrates the process of producing a NICER spectrum. In this tutorial we will assume that you wish to produce PHA spectral files to be used with XSPEC. This thread is now obsolete. Read this thread if you want to: See obsolete information about creating PHA spectral files from NICER event data Last update: 2022-10-26 IntroductionPlease note: this thread is obsolete. Please see the Manually Extracting a NICER Spectrum thread for updated information. NICER scientific analysis ultimately leads to light curve (timing) analysis and spectral analysis. For spectral analysis, the user will create a NICER spectrum and then perform spectral modeling. NICER spectra typically have 1500 bins, and each bin covers 10 eV (see Gain Calibration for more information about NICER spectra details). For all spectral analysis, use the NICER "PI" channel, which is the default. After running the standard processing pipeline nicerl2, a cleaned, MPU-merged event file is produced. This output product is the "cl" file, and this is the event file which you will use for spectral analysis. We will use the tool "xselect" for spectral extraction. Following this, XSPEC can be used for spectral analysis and modeling. The tool we use to bin the data is the HEASoft XSELECT package and the output data type is a PHA file. For the purposes of this tutorial we will assume that you wish to make a spectrum from a single, MPU-merged, cleaned event data file from a single OBSID. PrerequisitesThis thread assumes you have the following prerequisites:
Using XSELECT to Generate SpectraThe process for creating a spectrum from merged, cleaned data is straightforward. In this example we are running XSELECT from a directory which contains the data from OBSID 1010080110, an observation of Cas A. Once XSELECT is called, the process is staright forward. Below is an example: First, start xselect:
prompt> xselect
xselect is a data processing environment where you type interactive
commands. We will type the commands to extract a spectrum.
If your "cl" file is not in the current directory, you can set the data
directory for the file like this.
Finally, we can extract a spectrum.
Save the extracted spectrum using the command,
You can plot your extracted spectrum within XSELECT:
	XSEL> set device /xs
	XSEL> plot spectrum
	PLT> log
	PLT> rescale x 10 1501
where each line of input is:
The resulting spectrum should look like this: 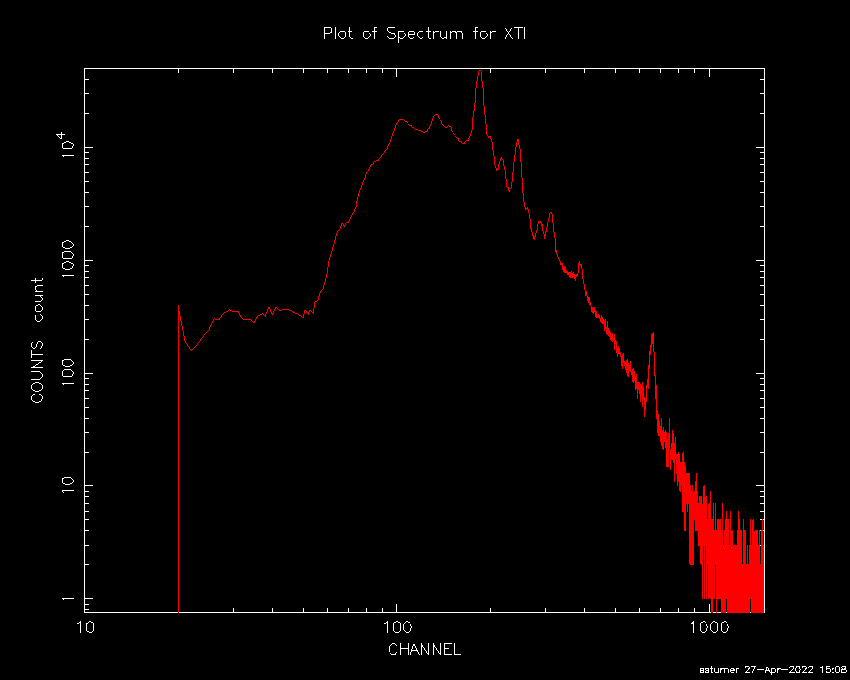
Please note that the X-axis is in units of "PI" channel bins (1 bin = 10 eV), so channel 100 = 1.0 keV. For more information on how to use the QDP plotting environment, please see the QDP/PLT User's Guide. For example, you can relabel axes, change from logarithmic to linear, etc. However, please be aware that xselect's plotting environment is not for spectral analysis. It is purely for display purposes.
When you are done plotting, use the EXIT command to exit the plotting
environment.
When you are done extracting and examining the spectrum, you can exit
XSELECT using the QUIT command.
When this process is complete, you will have an output spectrum file (named myspectrum.pha in this example), which you can use for further spectral analysis. CaveatsIt should be noted that XSELECT is a powerful tool that the user can use to perform many actions on their data. The user, for instance, may wish to use XSELECT to filter their events using the pha_cut parameter to restrict the energy range of the data for light curves. By default, such settings will carry forward to later extractions, which are undesirable.
If a spectrum is then extracted without resetting this
parameter, the resulting spectrum will have less than the standard
1501 channels which are present in NICER response matrices. Spectra
should always be extracted for the entire range of 1501 channels.
Use the XSELECT command CLEAR to remove any pha_cut filters.
Next Steps: Response and Background GenerationThe process desccribed above produces the XSPEC compatible spectral spectrum file for your event data. In order to perform spectral analysis in XSPEC, one must then also create detector response and background files for that data. Analysis threads for the procedures to generate these files are given here: Modifications
|


- HEASARC Director: Vacant
- NASA Official: Ryan Smallcomb
- Web Curator: J.D. Myers
- Last Modified: 26-Oct-2022