

THE XMM-NEWTON ABC GUIDE, STREAMLINED
Fit an EPIC Spectrum with Xspec (via Hera)
While various ftools and Xspec can be run from the Hera Parameter Window, it is easier to do it from the Command Window, so we will demonstrate that here.
We will do some simple spectral fitting, using as an example the source and background that was extracted from the Lockman Hole observation (Obs ID 0123700101) and its RMF and ARF files.
Prior to fitting, users are encouraged to read this Guide's discussion on statistics. More information can be found in Humphreys et al. (2009).
For this example, we are interested in just a quick fit to see what we are dealing with, so we will rebin the data. The procedure grppha from FTOOL provides an excellent mechanism to do just that. The following commands not only group the source spectrum for Xspec but also associate the appropriate background and response files for the source.
To rebin the spectrum with grppha, navigate to your working directory with the spectra in it, then enter in the Command Window:
grpphaand edit the parameters as needed:
   >Please enter PHA filename[] mos1_pi.fits      ! input spectrum file name
   >Please enter output filename[] mos1_pi_grp30.fits  ! output grouped spectrum
   >GRPPHA[] chkey BACKFILE bkg_pi.fits           ! include the background spectrum
   >GRPPHA[] chkey RESPFILE mos1_rmf.fits         ! include the RMF
   >GRPPHA[] chkey ANCRFILE mos1_arf.fits         ! include the ARF
   >GRPPHA[] group min 30                         ! group the data by 30 counts/bin
   >GRPPHA[] exit
Next, invoke Xspec in the Command Window to fit the spectrum:
xspec
Enter the data at the prompts, and edit the fitting parameters as needed.
When given the "plot" command, Hera will open a new tab in your web browser and
display the plot as a GIF file.
XSPEC> data mos1_pi_grp30.fits ! input data
XSPEC> ignore 0.0-0.2,6.6-** ! set a range appropriate for the data, in keV
XSPEC> model pow ! set spectral model to a power law
1:powerlaw:PhoIndex> 2.0 ! set the power law index to 2.0
2:powerlaw:norm> ! default model normalization
XSPEC> renorm ! renormalize the model spectrum
XSPEC> fit ! fit the model to the data
XSPEC> setplot device /xw ! set the plot device
XSPEC> setplot energy ! plot energy along the X axis
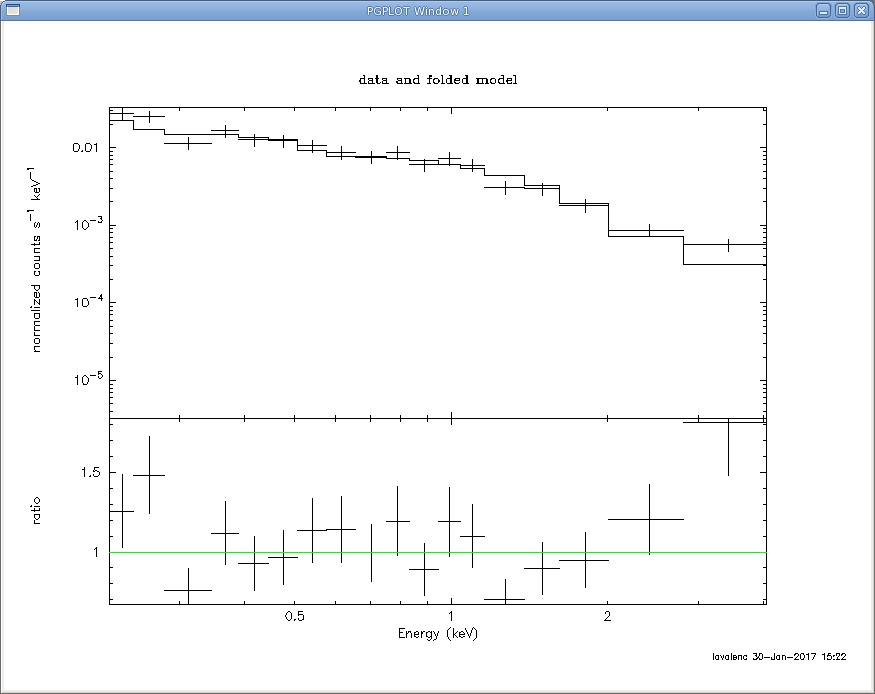
XSPEC> plot ldata ratio ! plot two panels with the log of the data and
! the data/model ratio values along the Y axes
XSPEC> exit ! exit Xspec
Do you really want to exit? (y) y
The spectrum is shown in Figure 1.
If you have any questions concerning XMM-Newton send e-mail to xmmhelp@lists.nasa.gov