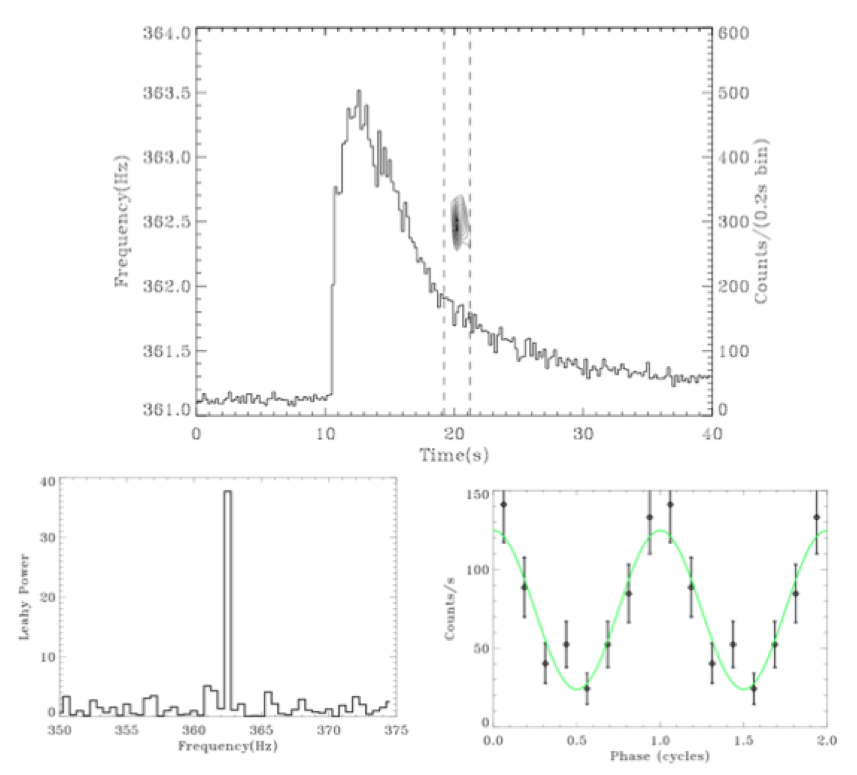
NICER / ISS Science Nugget for July 5, 2018NICER Observes Unusual Burst Oscillations in 4U 1728-34Type I X-ray bursts are thermonuclear explosions on the surfaces of neutron stars found in Low Mass X-ray Binaries (LMXBs). Lasting tens of seconds, these unpredictable flashes in X-rays are due to unstable burning of material accreted from a companion star. Coherent pulsations in brightness, known as burst oscillations, have been observed in the rise and/or tail of some X-ray bursts. In 2003, the discovery of burst oscillations at a frequency of 401 Hz from the accretion-powered pulsar SAX J1808.4-3658 revealed that the oscillation frequency was very close to the star's known spin frequency, establishing burst oscillations as nuclear-powered pulsations that can be used to estimate the spin rates of other accreting neutron stars. The fractional root-mean-squared (rms) amplitude of burst oscillation signals is usually between 5% and 20%. There are some cases where larger amplitudes have been observed in the rising phase of a burst, but burst oscillations seen in the tail usually have smaller amplitudes. NICER has observed an unusually large-amplitude burst oscillation, one that occurred in the tail of a burst from the LMXB 4U 1728-34, with a fractional rms of 51.7 ± 9.5%. This is the largest amplitude ever observed for oscillations in a burst tail. The fact that this signal has been observed only at high X-ray energies (above 6 keV) and with such a large amplitude is very puzzling, challenging our current theoretical models of thermonuclear explosions and flame propagation in the extreme gravitational, nuclear, and electromagnetic environment of a neutron star's surface.
NICER
|


- HEASARC Director: Vacant
- NASA Official: Ryan Smallcomb
- Web Curator: J.D. Myers
- Last Modified: 19-Feb-2019