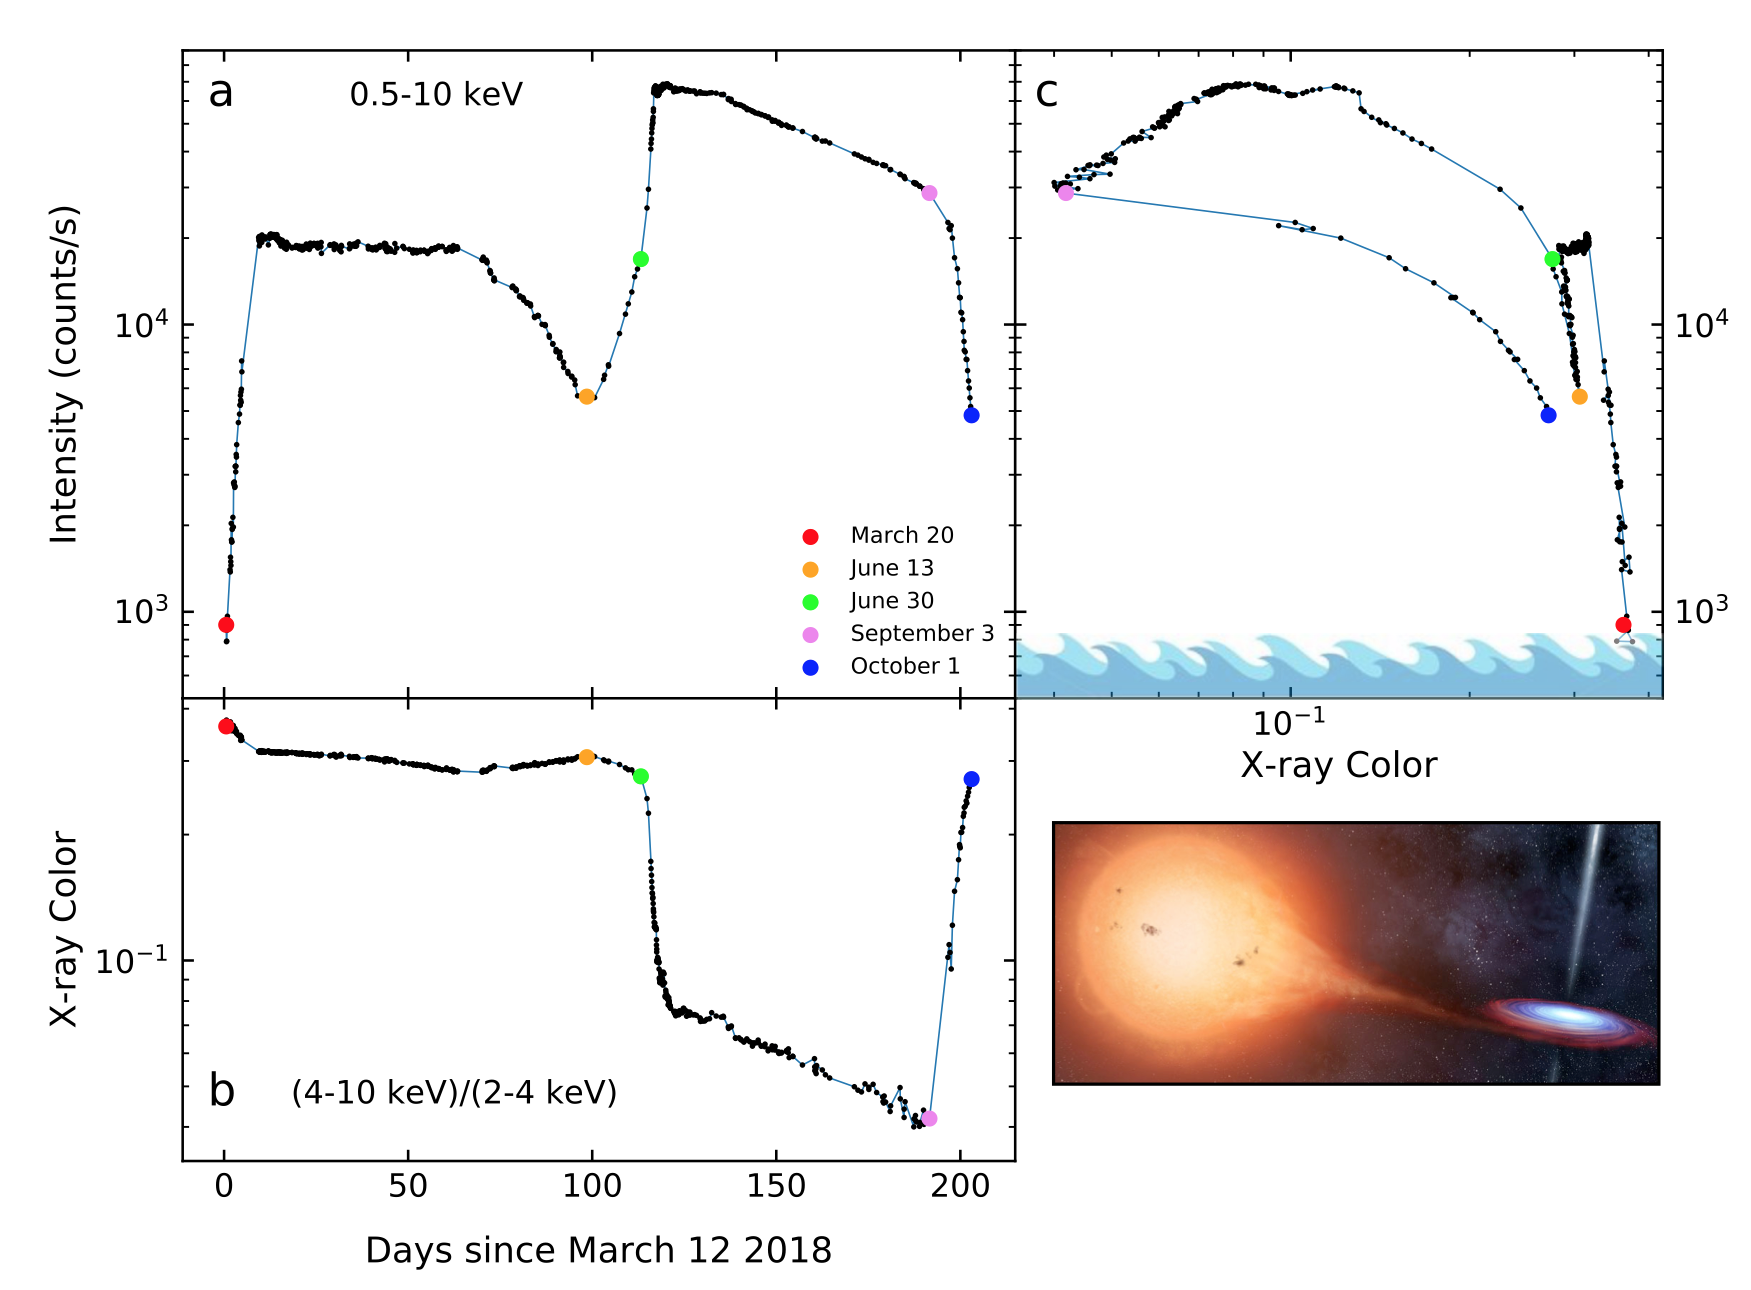
NICER / ISS Science Nugget for October 5, 2018The 2018 outburst of MAXI J1820+070 as seen with NICERBlack hole X-ray binaries are systems in which a sun-like star orbits a stellar-mass black hole. At some point in the life of these systems the sun-like star will start to expand and, due to the gravitational pull of the black hole, matter from the star will begin to transfer, resulting in the formation of an accretion disk around the black hole. An artist's impression of a black hole X-ray binary can be seen in the accompanying figure. As matter spirals inward through the disk and toward the black hole, it heats up to temperatures of millions of degrees, resulting in the thermal emission of X-rays. These X-rays carry information about the properties of the black hole and its close environment. The accretion of matter into a black hole is generally not a continuous process. Over time matter accumulates in the outer parts of the accretion disk and occasionally this matter is dumped into the black hole over a period of weeks to months. This is observed as an outburst of X-ray emission from the source. It is during such outbursts that most of these otherwise dormant black holes are discovered. This was also the case for MAXI J1820+070, a black hole X-ray binary that was first detected in X-rays in early March of this year. NICER has observed the outburst of MAXI J1820+070, which is nearing its end, in great detail.
MAXI J1820+070 traced out a dolphin-shaped loop in the color-intensity diagram (in a counter-clockwise direction). Importantly, it reveals that the change from spectrally hard to soft occurred at a higher count rate than the change from soft to hard. This decoupling between brightness and spectral properties has been seen in other sources as well (although rarely in such beautiful detail), but is still poorly understood. We expect that an analysis of the full NICER dataset of the outburst will shed new light on the origin of the color-intensity loops. NICER
|


- HEASARC Director: Vacant
- NASA Official: Ryan Smallcomb
- Web Curator: J.D. Myers
- Last Modified: 19-Feb-2019