NICER / ISS Science Nugget
for December 22, 2022
A Pair of Telescopes Discerns a Pair of Coronae
The strong gravity around a black hole drawing matter from a companion star in a binary system sculpts the flow of gas into structures that are too small (hundreds to thousands of kilometers in extent) to capture in images with even our highest-resolution telescopes. Instead, scientists use a system's time-varying brightness to probe these scales, employing "spectral-timing" techniques that examine relationships between any quasi-periodic oscillations (QPOs) in X-ray brightness and the spectrum of photon energies detected, or with associated phenomena at other wavelengths-in particular, radio emission that is believed to represent particle radiation accelerated in relativistic jets of gas ejected by the black hole.
During 2021, the well-studied black-hole binary GX 339-4 erupted in an outburst that was extensively tracked by NICER. Previous work, with NICER and other telescopes, had demonstrated that the emergence of Type B QPOs (typically in the 1-10 Hz range of oscillation frequency) could be associated with the appearance of a radio-bright jet, and that these phenomena tend to occur shortly before an outburst's peak brightness. In the 2021 outburst, Type B QPOs were indeed seen by NICER (Figure 2) as well as, fortuitously, by the Indian Space Research Organization's AstroSat observatory, which covers a band of higher-energy X-rays (3-70 keV) than does NICER (0.2-12 keV). A paper by V. Peirano and collaborators, recently accepted for publication in the peer-reviewed U.K. journal Monthly Notices of the Royal Astronomical Society, describes analysis and modeling of the simultaneous NICER-AstroSat dataset. The team finds that the strength of the Type B QPO from GX339-4 grows with photon energy from ≅1% amplitude in the NICER band to as much as 17% at the high end of the AstroSat band. They also demonstrate that these oscillations arrive later at our telescopes at both lower and higher energies than near the mid-point of NICER's band; this behavior is described as a U-shaped QPO lag spectrum. Combining this information with the time-averaged energy spectrum of GX339-4, the authors derive a model in which hot plasma-responsible for up-scattering low-energy photons from the accretion disk to higher energies-is configured in two separate geometric regions around the black hole: a smaller, roughly spherical structure approximately 300 km in extent, and a larger, elongated or roughly cylindrical structure up to 18,000 km in size. They propose that the latter may be associated with the base of the relativistic jet seen in the radio.
Future observations of black-hole transients, with NICER and partner observatories, will further elucidate the geometry and processes associated with strong-gravity accretion flows around black holes.
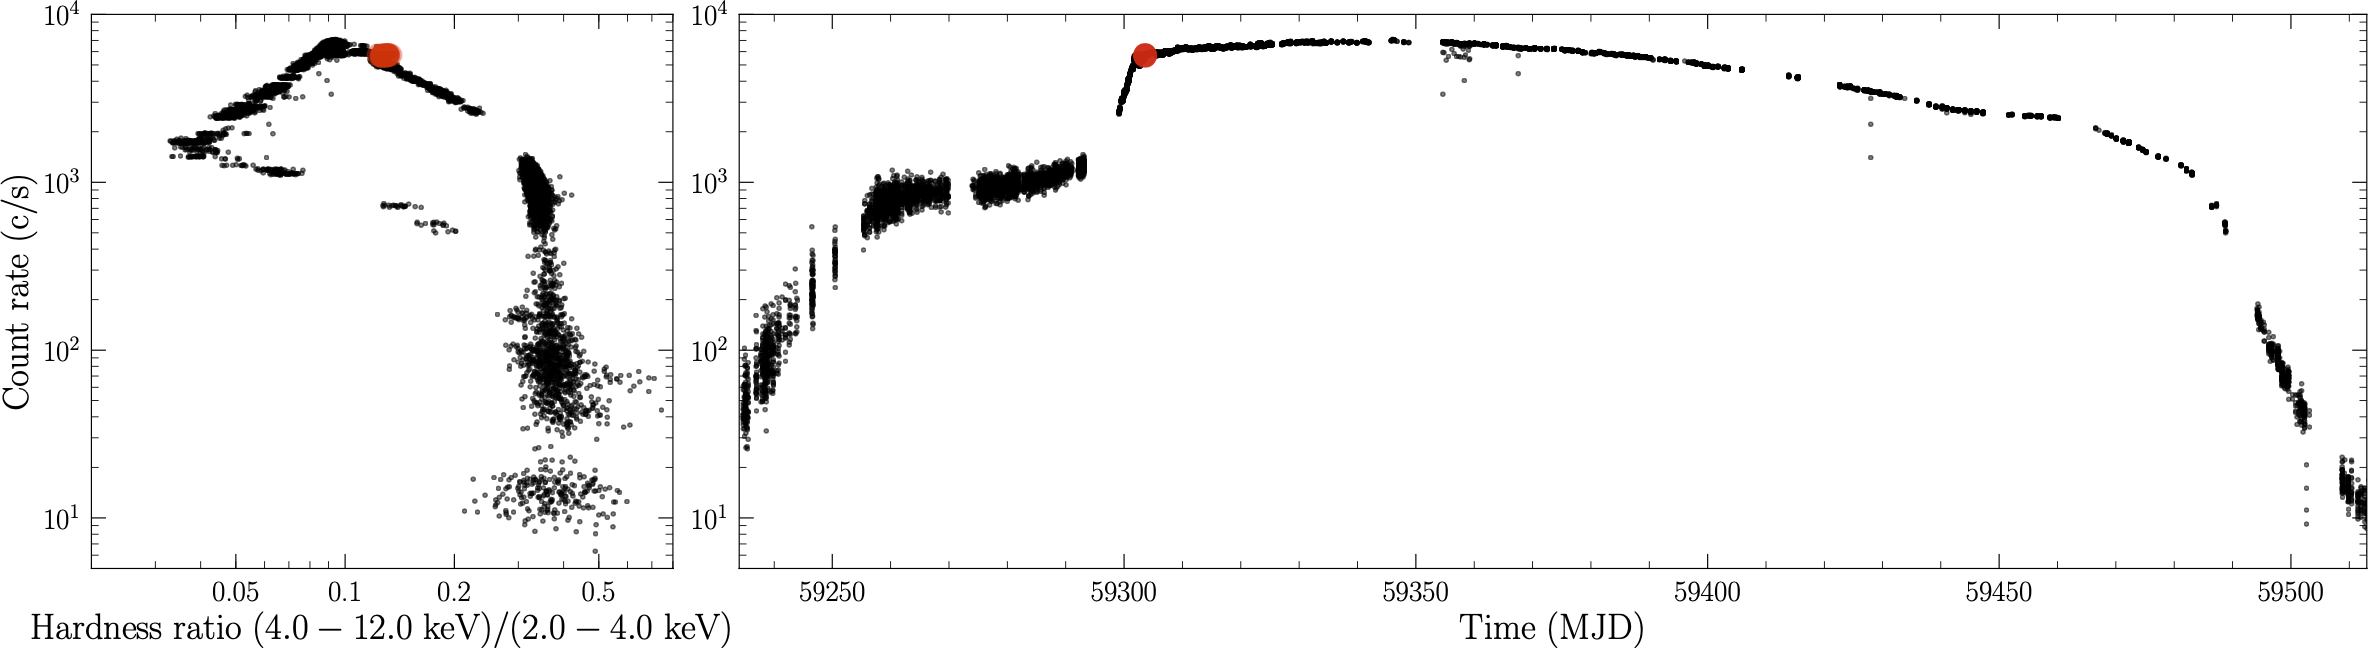
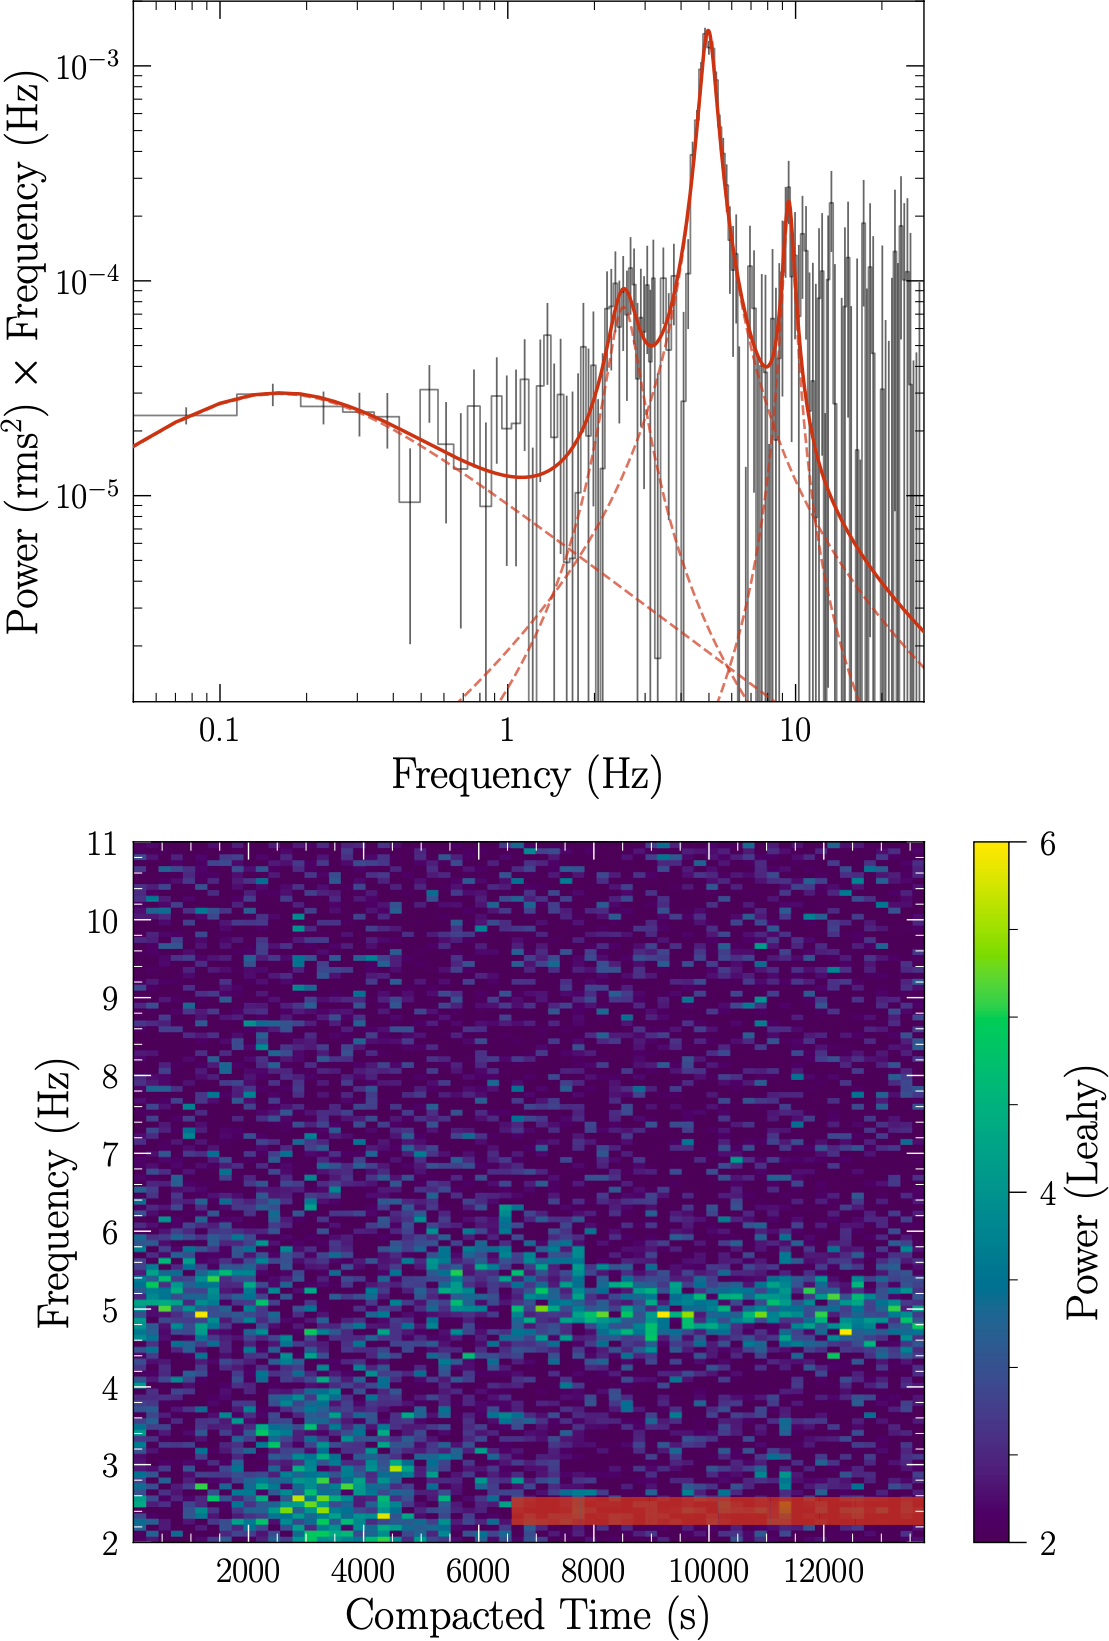
Figure:
Left: 2021 outburst of the black-hole low-mass X-ray binary GX339-4, as captured by NICER over nearly 280 days. The vertical axis in both panels is X-ray brightness in units of photons per second detected by NICER's X-ray Timing Instrument. The horizontal axis in the right-hand panel is time in Modified Julian Days; in the left-hand panel, it represents the "hardness ratio," or the relative brightness in NICER's high (4-12 keV) and medium (2-4 keV) photon energy bands. Red dots indicate times at which so-called Type B quasi-periodic oscillations (QPOs) were detected, at the start of the brightness plateau known as the soft-intermediate state. Each individual black data points corresponds to approximately 13 seconds of data. (Figure credit: Peirano et al. 2023)
Right: The power-spectral density (PSD)-a measure of the strength of brightness fluctuations at specific modulation frequencies-of NICER data obtained while Type B QPOs were present. The time-averaged PSD in the top panel shows the primary QPO peak at approximately 5 Hz, with a (sub-)harmonic peak at (half) twice that frequency. The solid red curve represents a best-fitting model, the individual components of which are shown with dashed curves. The lower panel displays the evolution of the PSD with time, where observation gaps have been removed. The red band indicates the time during which NICER and the Indian AstroSat observatory were observing simultaneously. (Figure credit: Peirano et al. 2023)
<< Previous
Main Index
Next >>

