NICER / ISS Science Nugget
for February 16, 2023
Mapping binaries with multiwavelength "echos"
Simultaneous observations at different wavelengths of light offer a means of probing the shapes and dispositions of objects in stellar systems much smaller than can ever be resolved with imaging telescopes, trading unattainable spatial resolution for measurements with high time resolution. NICER's flexible scheduling enables coordination with multiple facilities; an example of such a partnership resulted in a paper recently published by T. Shahbaz (Instituto de Astrofisica de Canarias, Spain) and collaborators in the peer-reviewed journal Monthly Notices of the Royal Astronomical Society (UK), describing observations of the binary system Swift J1858.6-0814, which hosts a neutron star that episodically accretes matter from a companion star.
Swift J1858 was discovered during a nearly 2-year-long outburst that began in late 2018. Extensive NICER observations tracked its hard flaring state and (after an interruption due to obstruction by the Sun) its softer steady state before the object faded into quiescence. On six occasions during March and June 2019, two ground-based optical telescopes hosting state-of-the-art high-speed optical cameras -- ULTRACAM on the 3.5-meter New Technology Telescope at La Silla, Chile, and HiPERCAM on the 10.4-meter Gran Telescopio Canarias on La Palma, Spain -- observed Swift J1858 at multiple wavelengths in the visible light band simultaneously with NICER in X-rays. Sub-second changes in brightness in X-rays are seen to correlate with slower changes in visible light. The team of scientists used auto- and cross-correlation functions (ACFs and CCFs) to characterize these variations and correlations quantitatively, drawing a number of conclusions about the relative origins of the X-ray and visible-light emissions, and comparing those results to prior measurements from both neutron-star and black-hole accreting binaries. For example, the peak positive lag of 2-3 s corresponds to a positive correlation (i.e., peaks following peaks) in which the optical emission is detected 2-3 seconds after the X-ray emission; such a delay is consistent with X-rays emitted close to the neutron star, in the hottest part of the accretion flow, being "reprocessed" (exciting atoms so that they emit optical light) in colder, more distant parts of the accretion disk. In identical measurements made at other times and at other orbital phases relative to our sightline, flaring X-ray emission is found to precede optical emission by up to 10-12 seconds, evidence that the X-rays are, in that case, exciting atoms on the companion star rather than in the accretion flow. The authors also draw a distinction between neutron-star and black-hole systems by noting the absence, in Swift J1858, of a short-timescale (~100 ms) lag that is seen in black-hole binaries. Together, the available data helps further characterize the nature of the stars, their orbit, and the flow of matter between them. The NICER team continues to facilitate simultaneous observations with telescopes across the electromagnetic spectrum, on the ground and in space.
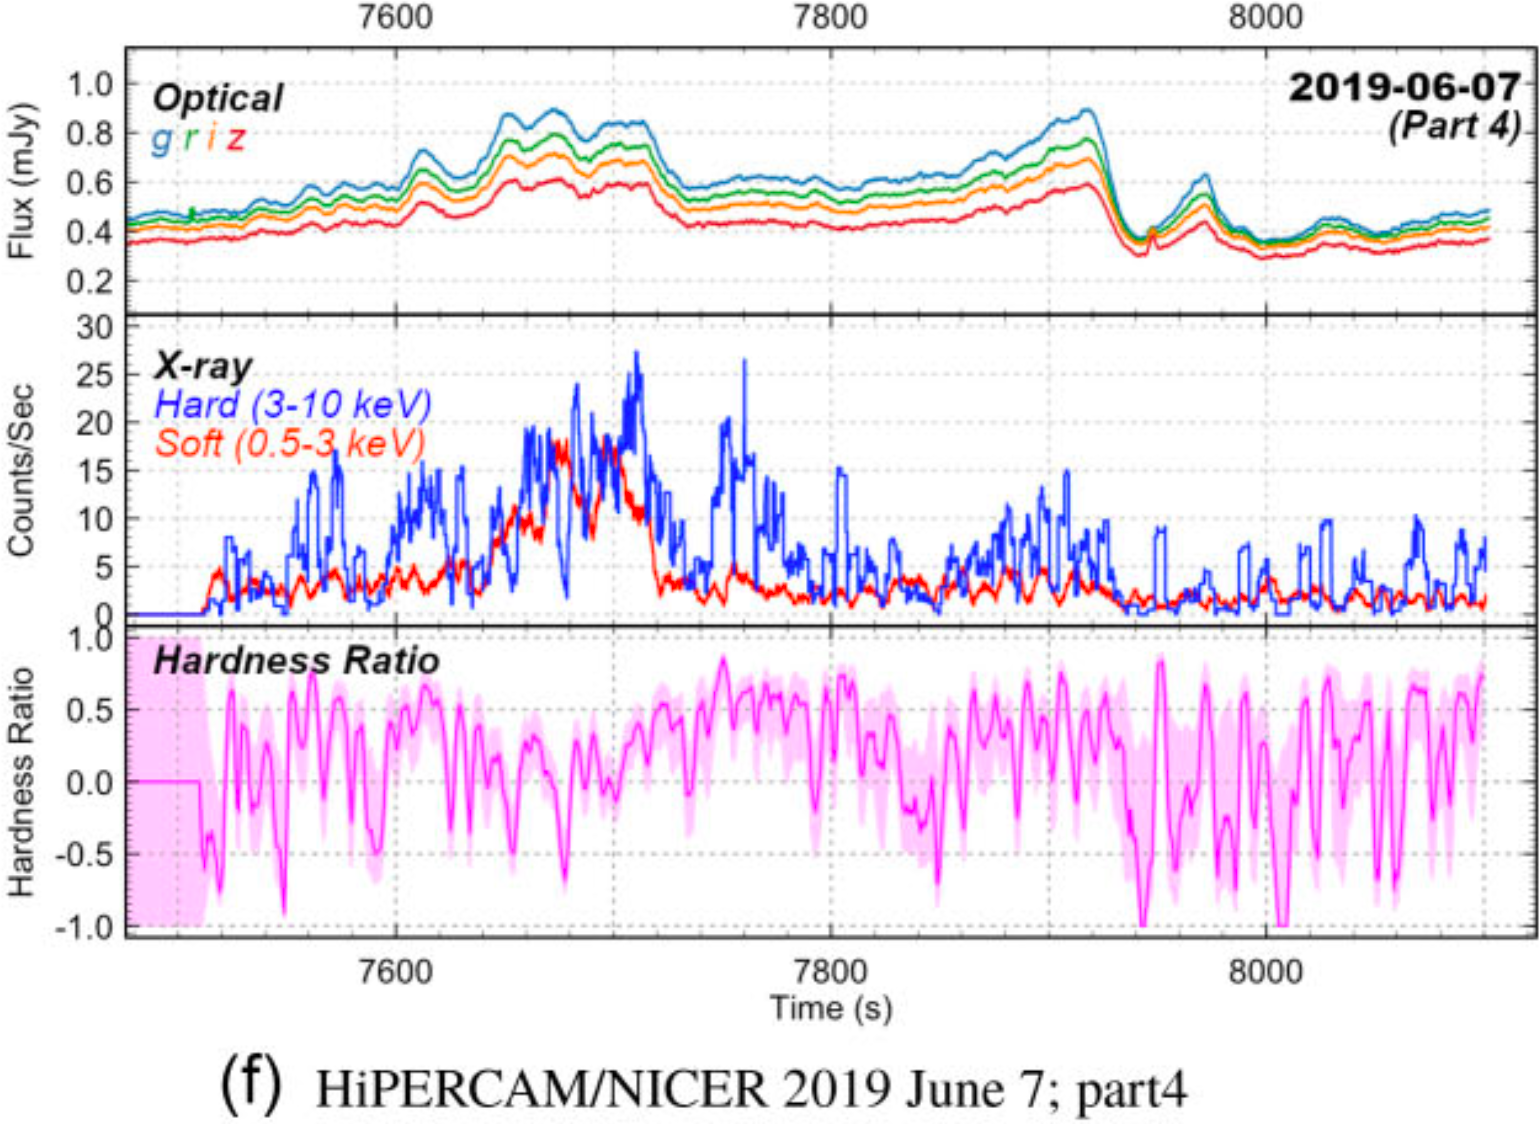
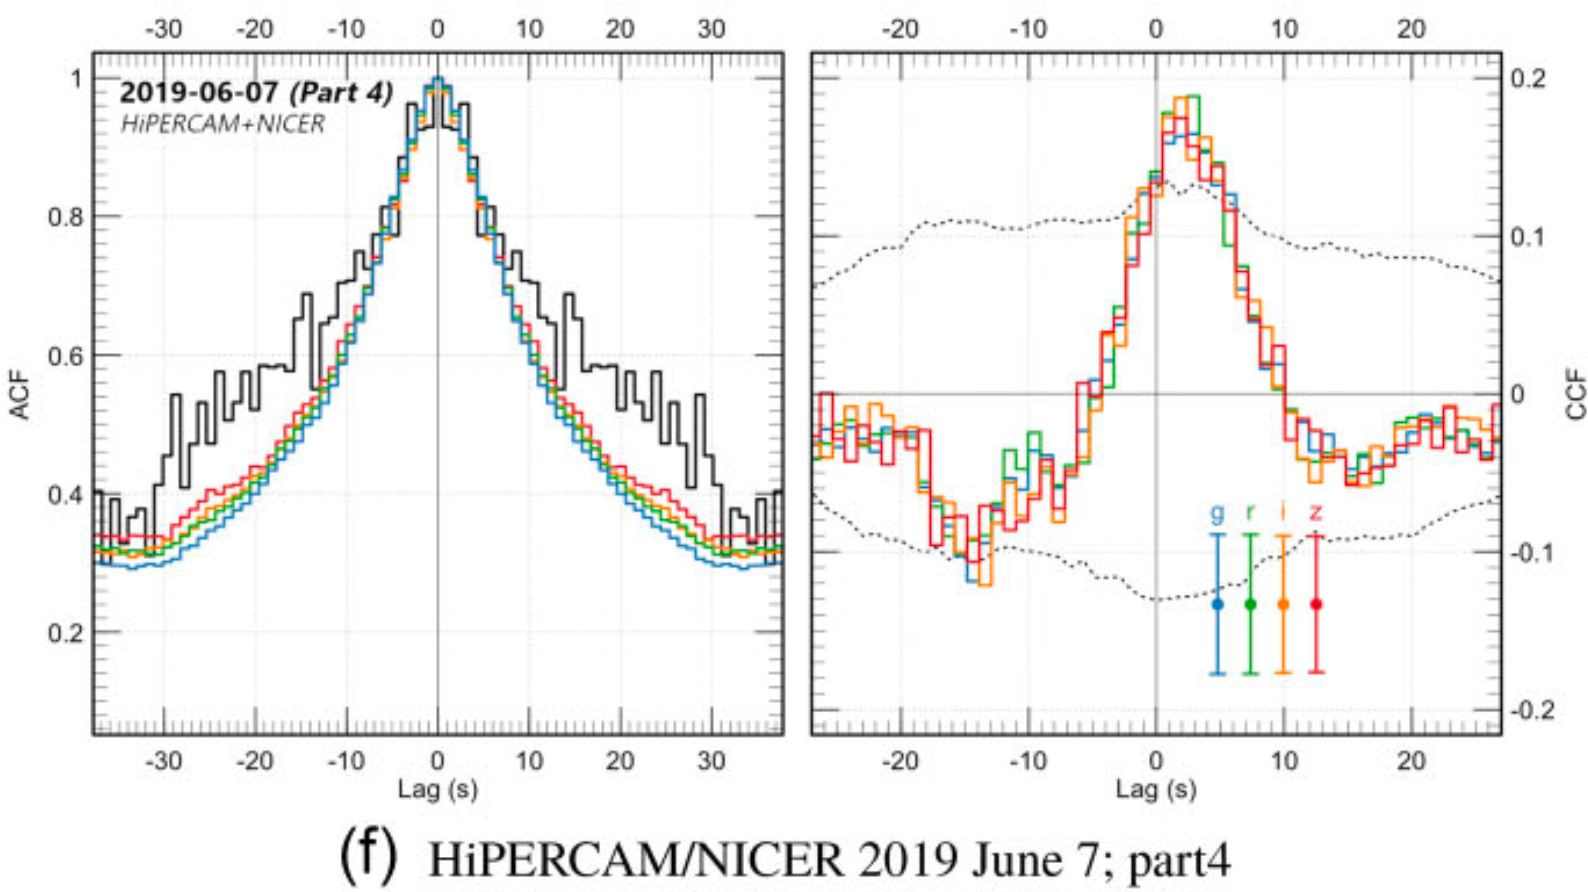
Figure:
Left: Brightness variations obtained in visible light (top panel) with HiPERCAM and in X-rays (middle panel) with NICER, together with the X-ray hardness ratio (high-energy relative to low-energy photon rates; bottom panel). Light blue, green, yellow, and red traces in the top panel represent different wavelengths of emission in the visible band; blue and red in the middle panel similarly represent different energy/wavelength bands in X-rays. Slow optical variations occur in correlation with fast X-ray variability. (Figure from Shahbaz et al. 2023)
Right: Measures of variability in the individual bands (autocorrelation functions, ACFs; left panel) and between the four optical bands and X-rays (cross-correlation functions, CCFs; right panel) for the lightcurves shown in Figure 1; black represents X-rays, other colors are as in Figure 1. The widths of the ACFs and CCFs, as well as the locations of dips (e.g., approx. -15 s) and peaks (2-3 s) reveal cause-and-effect relationships between the emission bands as well as their relative geometry -- distances and locations relative to our line of sight. (Figure from Shahbaz et al. 2023)
<< Previous
Main Index
Next >>

