NICER / ISS Science Nugget
for March 30, 2023
A broadband view of X-ray bursts
One of NICER's frequent partners in coordinated astrophysics observations is NASA's Nuclear Spectroscopic Telescope Array (NuSTAR), which offers complementary capabilities; NuSTAR is sensitive, for example, to a band of photon energies (3-79 keV) that is substantially higher but usefully overlaps with NICER's band (0.2-12 keV). In June 2022, both telescopes observed the newly discovered neutron-star binary system MAXI J1816-195, in its first known outburst. With target visibility determined by the ISS and NuSTAR orbits, a portion of the coordinated observations was performed strictly simultaneously, and by good fortune two Type I X-ray bursts were detected by both telescopes on 23 June. These bursts result from the unstable thermonuclear burning of light elements - typically hydrogen, helium, or both - on the surface of a neutron star that is accreting matter from a companion star. Type I bursts occur unpredictable times, but offer unique insights into the burning fuel's chemical composition and rate of deposition, the properties of the surface, and the evolution of burning in an extreme physical environment (strong gravity, exceptionally high matter densities, rapid rotation, and high magnetic fields). Analysis of the burst data from both telescopes - specifically the application of physical and empirical models to the data - reveals the time-evolution of the temperature and extent of the explosion debris as well as any effects on the persistent (non-burst) emission that originates in the accretion flow. Among other inferred results, researchers have determined that the MAXI J1816 system lies at a distance of less than 8.6 kiloparsecs (26,000 lightyears, or roughly the Sun's distance from the center of our Galaxy), and that the emitting area of the "mushroom cloud" at the moment of the bursts' peak brightness is consistent with a sphere of radius 12.5 km, the expected size of a neutron star, so that the explosion essentially engulfs the star's atmosphere. These results were recently published by M. Mandal (Midnapore City College, India) and collaborators in the peer-reviewed UK journal Monthly Notices of the Royal Astronomical Society.

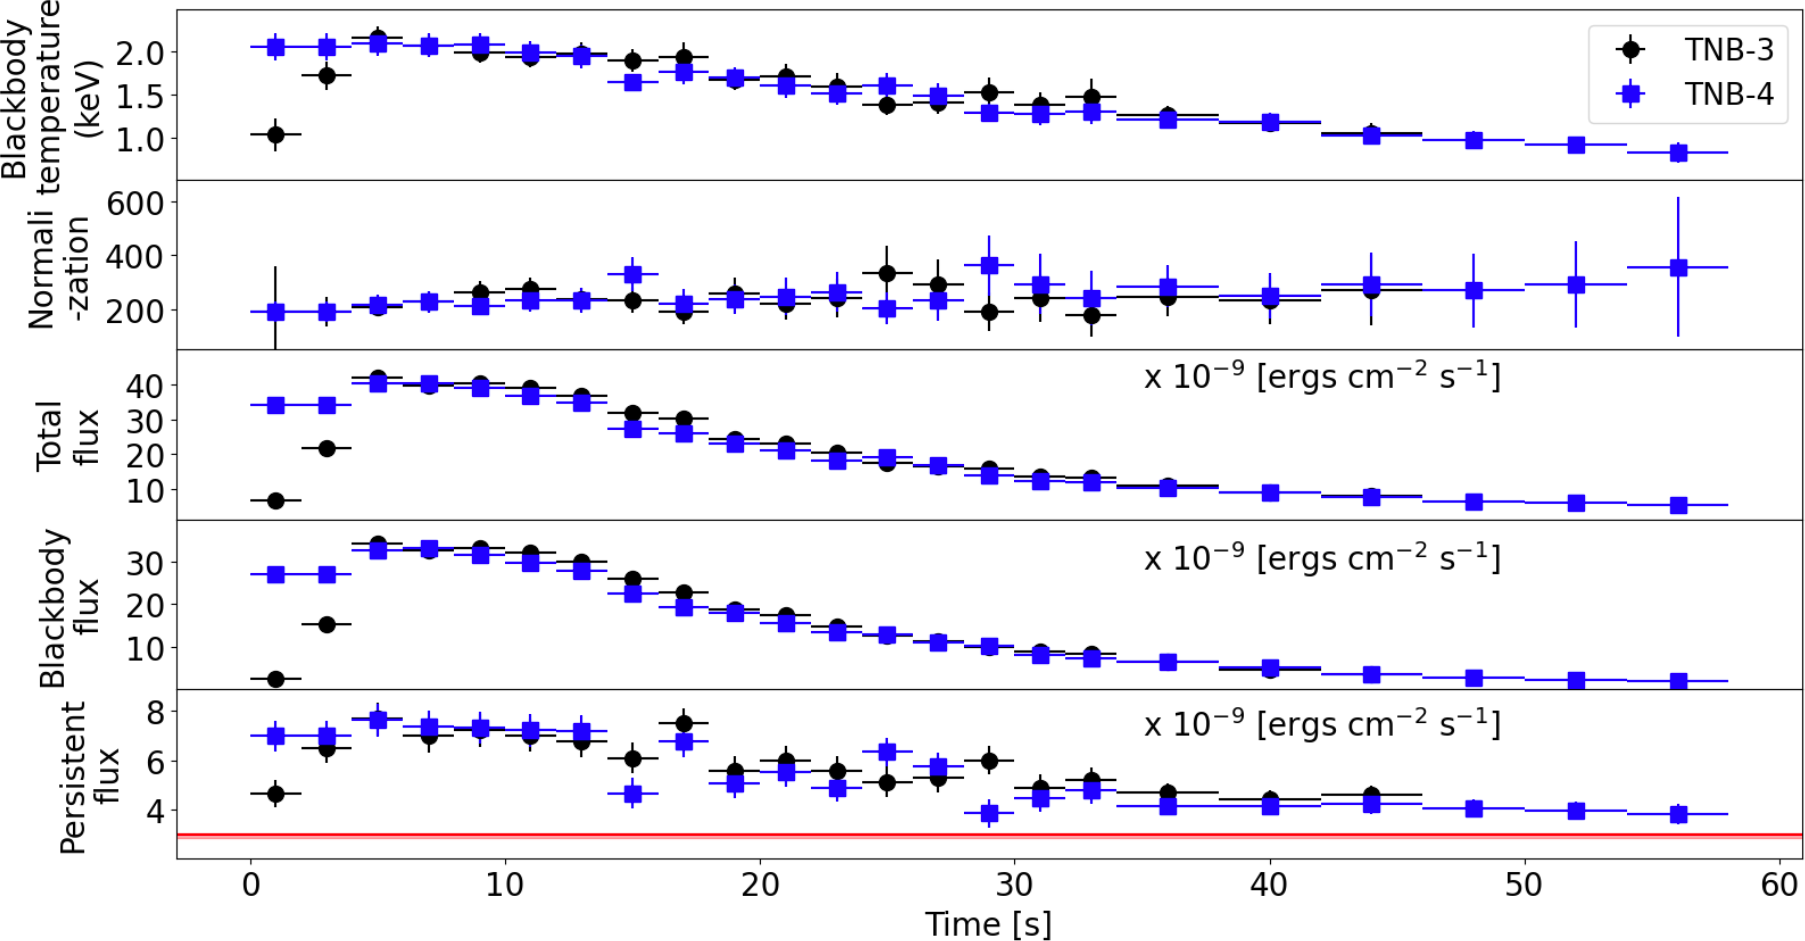
Figure:
Left & Center: NICER measurements of X-ray brightness (the rate of photon counts per second), in three bands of photon energies (colored traces), during thermonuclear X-ray bursts on 23 June, 2022. Both bursts were also observed with NASA's NuSTAR telescope, which detected emission in the peaks of the bursts at energies up to 20 keV. (Figure credit: M. Mandal et al. 2023)
Right: Results of time-dependent spectral-model fits to the joint NICER-NuSTAR data for the June 2022 bursts. The model consisted of a thermal (blackbody) component to characterize the hot plasma, together with a scaled version of the persistent (pre- and post-burst) emission, which was modeled separately. The panels, from bottom to top, represent the scaling factor of the persistent emission, the thermal brightness, the total brightness, the thermal component normalization (which scales with the emitting area), and the temperature of the burst plasma. (Figure credit: M. Mandal et al. 2023)
<< Previous
Main Index
NICER
Science Nuggets
Listed by year:
Listed by topic:
|

