NICER / ISS Science Nugget
for August 24, 2023
Pulsing Corona in an AMXP?
Two dozen accreting millisecond X-ray pulsars (AMXPs) are known. These are systems in which a neutron star has been spun up to extreme rotation rates -- hundreds of revolutions per second -- by the transfer of mass and angular momentum from a low-mass companion star. In June 2022, NICER discovered two of the known AMXPs within one week by promptly following up detections of X-ray flares made by JAXA's MAXI payload. One of these discoveries, MAXI J1816-195, progressed through its outburst across 23 days, with NICER tracking this longest-timescale brightness evolution through to quiescence. On the shortest timescales, MAXI J1816 's brightness varied as a result of its fundamental pulsations every 1.9 milliseconds. Between these extremes, additional fluctuations were seen, as is typical of AMXPs: bursts (Type I) resulting from thermonuclear explosions on the neutron star surface as well as quasi-periodic oscillations (QPOs) of indeterminate origin.
A comprehensive timing analysis of the low-frequency variability of MAXI J1816 was recently published by P. P. Li (Chinese Academy of Sciences, China) and collaborators in the peer-reviewed UK journal Monthly Notices of the Royal Astronomical Society. The authors focus on a timing feature with a characteristic frequency between 2 and 4 cycles per second (Hz). This QPO was only seen during a portion of the outburst's decline, when the overall brightness was approximately half of its peak. Timing features at similar frequencies have been seen from other AMXPs, and have been attributed to phenomena at or near the neutron star, but the 2-4 Hz feature from MAXI J1816 presented some mysterious properties -- most surprisingly, the QPO survived a Type I burst, which would be expected to disrupt, or at least significantly alter, the innermost accretion flow. The survival of the 2-4 Hz oscillation, together with its scaling with photon energy and other properties, suggests that it originates far from the neutron star, in a hot plasma generically described as a "corona" because of its crown-like configuration vertically displaced from the accretion disk. Such variability provides novel clues to the location, geometry, and plasma content of the mysterious corona, as well as its interactions with the accretion disk and central star.
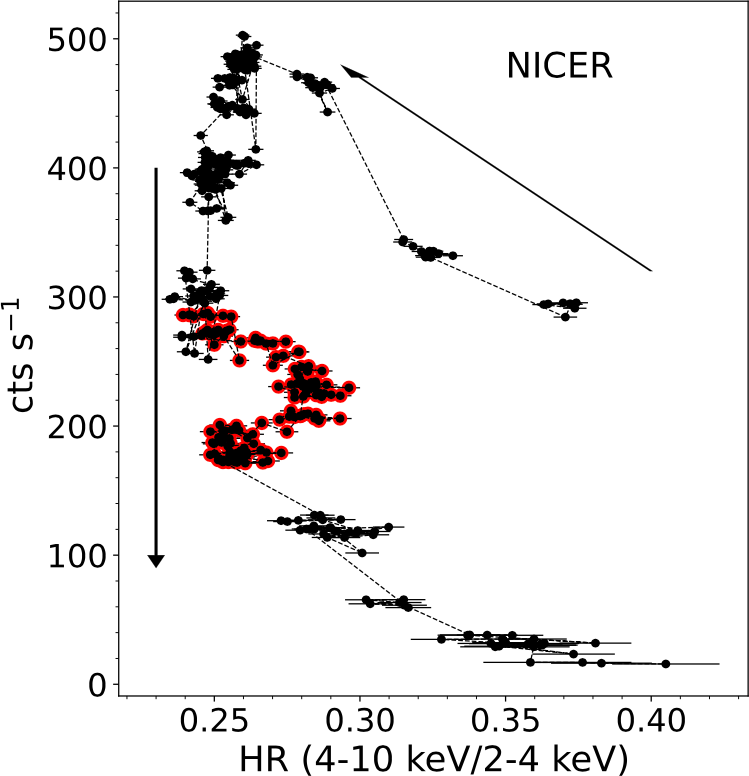
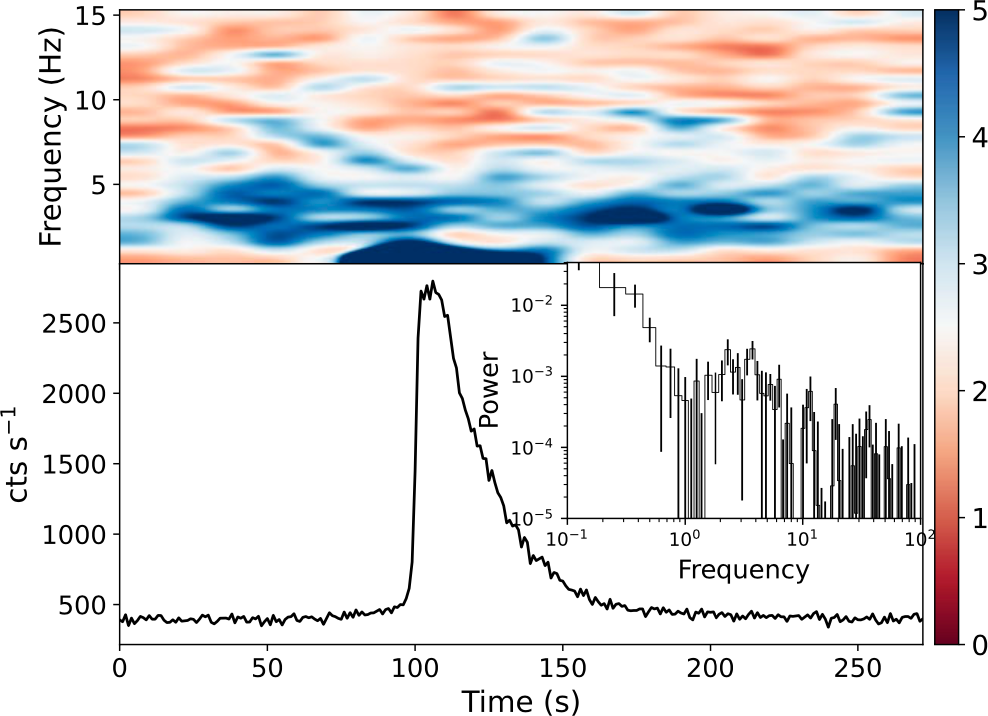
Left: A "hardness-intensity diagram" summary of NICER data for the accreting millisecond pulsar MAXI J1816-195 during a 3-week-long outburst in June 2022. The rate of photon detections, in counts per second, is on the vertical axis; hardness ratio, a single-value measure of the distribution of photon energies (counts in the 4-10 keV band divided by counts in 2-4 keV) is on the horizontal axis. Evolution with time, generally in a counterclockwise direction, is indicated with arrows. Points outlined in red show observations during which quasi-periodic brightness variations at 2-4 cycles per second were observed. Right: A dynamic power spectrum (upper panel and color-bar) captures the degree and timescales of variability exhibited by MAXI J1816 before, during, and after a thermonuclear burst. Notably, the 2-4 Hz oscillations remain visible even during the burst peak and decay (lower panel, where the inset shows the averaged power spectrum during the 100-150 sec interval). (Credit: Li et al. 2023)
<< Previous
Main Index
Next >>

