NICER / ISS Science Nugget
for December 14, 2023
Evidence for a rapidly dynamic corona
X-ray spectroscopy observations of black-hole binaries over three decades have shown that multiple sources of emission contribute to the total observed flux. These include the low-energy thermal glow of million-degree gas in an accretion disk, dominated by matter closest to the black hole, deep in its gravitational well, as well as highly energized and ionized gas in a poorly understood structure that dominates at higher energies, generally dubbed a "corona." There are also spectroscopic signs of interactions between the two components, thought to indicate reprocessing, or "reflection," of the coronal X-rays in the accretion disk. But spectroscopy alone has proven insufficient to fully constrain the locations, shapes, and sizes of the emitting regions, and thus any cause-effect relationships between them. Because black-hole systems can exhibit significant brightness variations, a promising avenue to explore geometric and propagation relationships is to supplement spectroscopy with timing. Spectral-timing techniques investigate the relative fluctuations of the disk and corona components, looking, for example, for "echoes" or delays that could be interpreted as flow propagation or changes in geometry.
In a manuscript accepted this week for peer-reviewed publication in the U.K. journal Monthly Notices of the Royal Astronomical Society, led by graduate student Neik Bollemeijer (Univ. of Amsterdam), NICER data from the only known outburst of the Galactic black-hole system MAXI J1820+070, in 2018, were analyzed to explore the spectral-timing properties of its variable X-ray emission. The team divided the full NICER energy range into two: a low-energy (0.5-1 keV) disk-dominated band, and a high-energy (3-10 keV) corona-dominated band, identifying common fluctuations between them and measuring their time lag. The analysis was further broken down across fluctuation frequencies, showing that the hard band behavior lags the soft band for slow variations, while the opposite is true for fast variations. Finally, the team developed and applied a novel technique for analyzing lag variations at the specific frequencies of quasi-periodic oscillations (QPOs), a common but nevertheless poorly understood component of the variability spectrum of accreting systems. A key prediction of QPO models that invoke relativistic precession in the strong-gravity black-hole environment is that time lags between soft and hard bands should change with the phase of the QPO cycle, reflecting time-dependent geometry in how the disk and corona are oriented relative to each other. Indeed, Bollemeijer et al. find evidence for such QPO-phase-dependent lags, modeling of which informs our understanding of the corona size and location while also constraining the black hole's mass and spin.
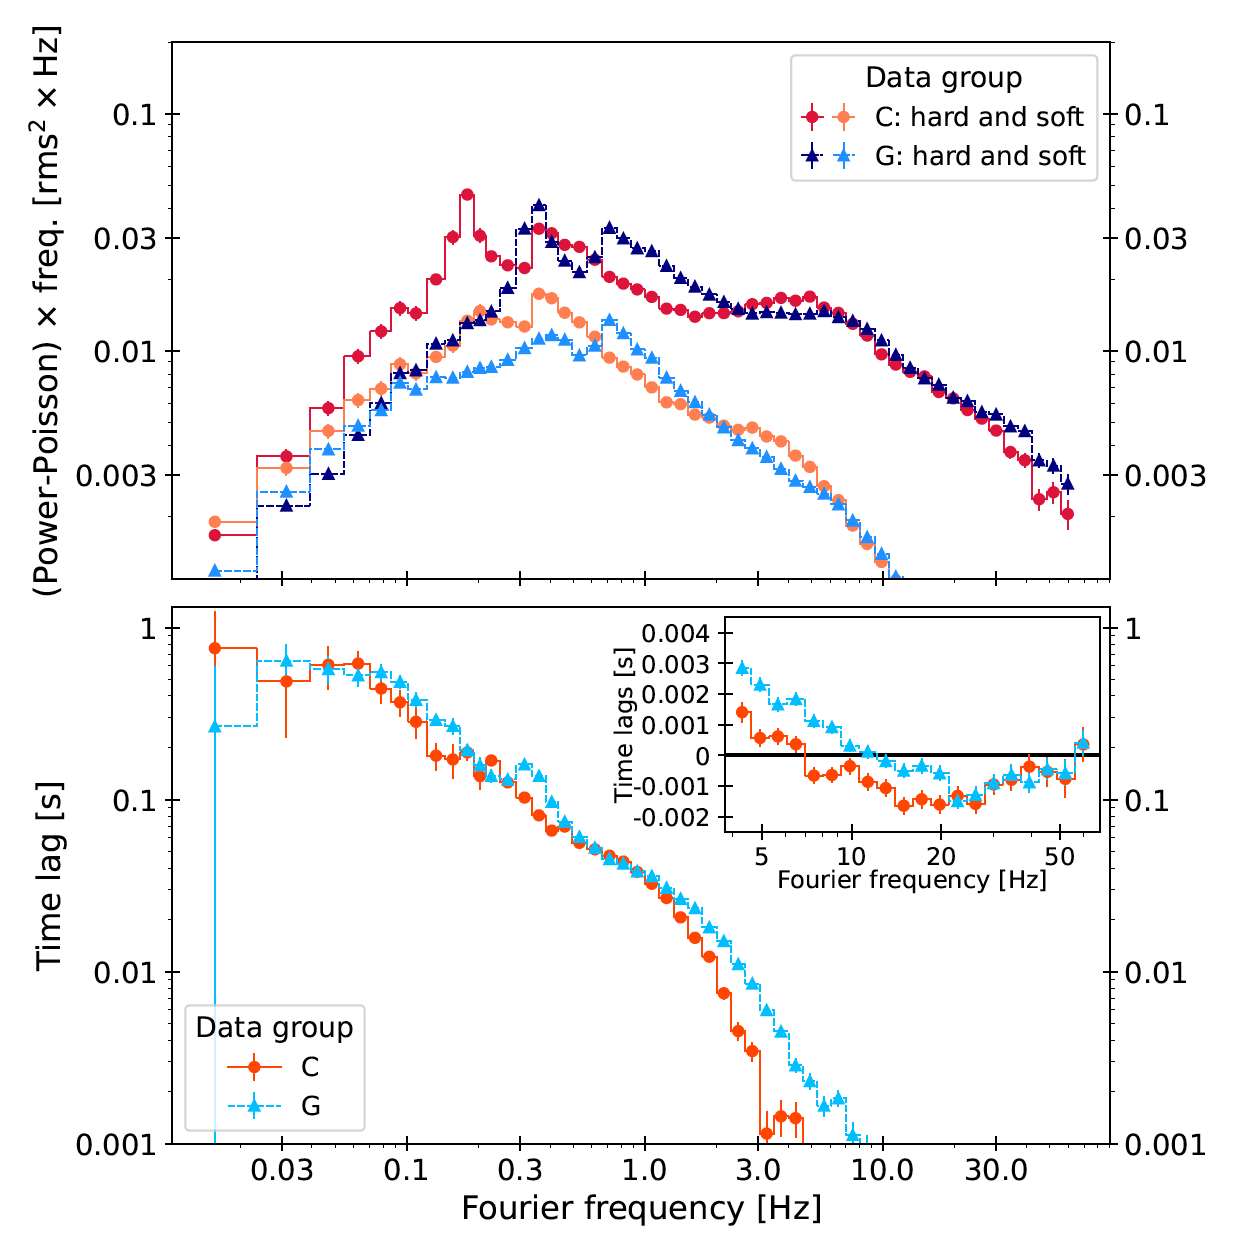
Left: Sample (2 of 10) datasets of black-hole binary MAXI J1820+070 observed by NICER across its evolution during the 2018 outburst. The upper panel shows power spectra -- the amplitude of variations at different fluctuation frequencies -- in low ("soft") and high ("hard") energy bands; peaks corresponding to quasi-periodic oscillations are more prominent in the hard band and shift to higher frequencies over time (approx. 0.2 Hz in red and 0.35 Hz in dark blue, with a harmonic at 2x those frequencies). The lower panel shows measured time lags between the hard and soft bands, with positive values indicating hard fluctuations follow soft, by tens to hundreds of milliseconds, while negative values (inset) show soft following hard on single-digit millisecond timescales. (Figure credit, Bollemeijer et al. 2024)
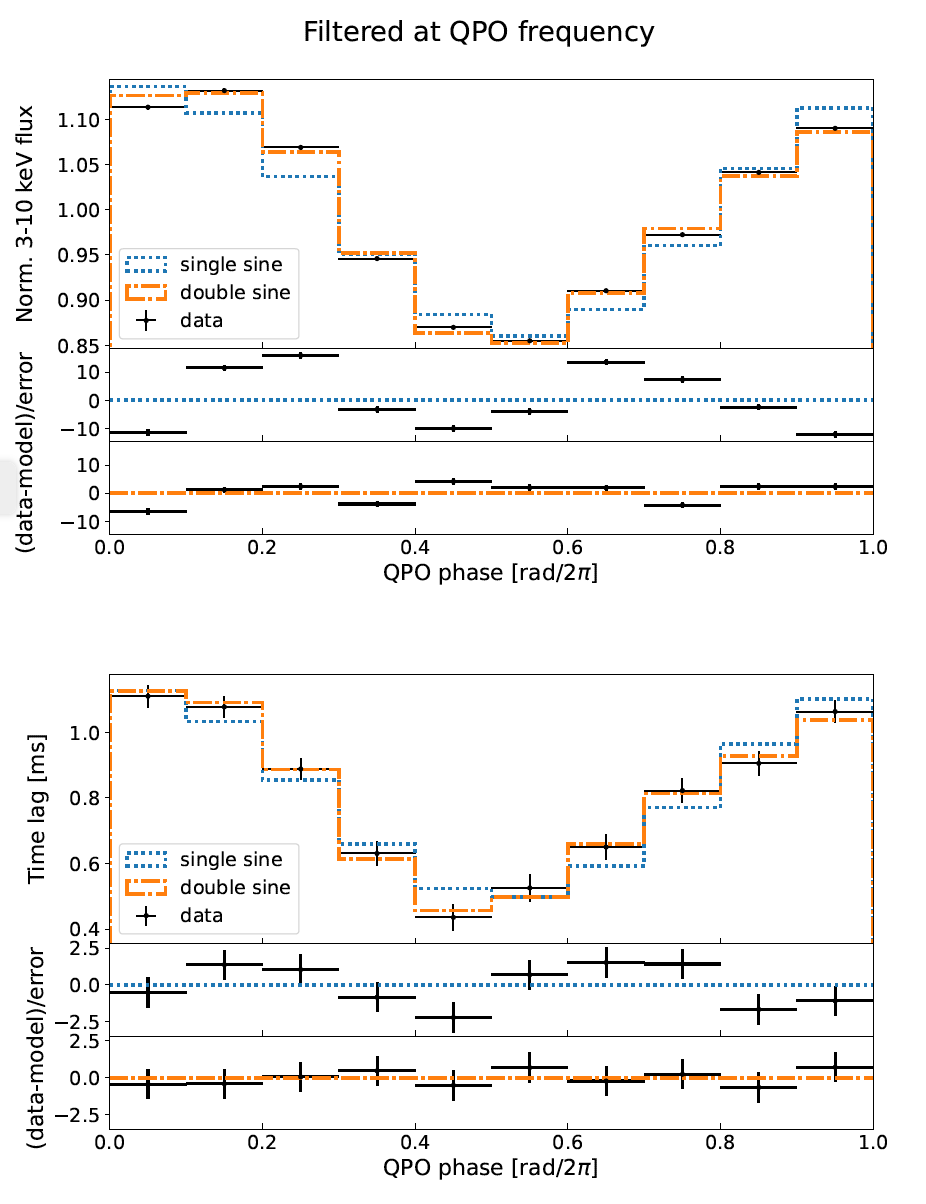
Right: Demonstration that time lags are strongly correlated with the rise and fall of the quasi-periodic brightness oscillations. The upper panel compares NICER hard X-ray brightness against two models (with one and two sine waves) across QPO cycle phase; the lower panel shows concurrence of the model with the time-lag changes that also vary with QPO phase. (Figure credit, Bollemeijer et al. 2024)
<< Previous
Main Index

