NICER / ISS Science Nugget
for February 8, 2024
Tracking dynamic plasmas
RS Ophiuchi is a recurrent nova - a binary star system in which a white dwarf (the remnant of a star comparable to our Sun that has run out of nuclear fuel and collapsed) draws matter from a companion star, accumulating it to the point where it periodically undergoes a runaway thermonuclear reaction, producing explosive brightening across the electromagnetic spectrum. In the case of RS Oph, these outbursts are seen approximately every 15 years, with the most recent beginning on August 8, 2021. One property of RS Oph that makes it unique is the nature of the companion star: a red giant that loses mass in a dense "wind" of gas primarily along its equator, with this material ultimately encircling the binary system. When the thermonuclear explosions on the white dwarf's surface drive ejecta into this circumbinary gas, a high-temperature plasma emits X-rays that reveal the chemistry and energetics of the outflow.
NICER's dense sampling of the 2021 outburst of RS Oph provided exceptional coverage of the event over 90 days, as reported in a peer-reviewed paper by N. Islam (Univ. of Maryland Baltimore County/NASA GSFC) and collaborators recently published in The Astrophysical Journal. High-energy X-rays followed visible-light and gamma-ray trends in peaking near the start of the outburst, when these emissions were dominated by the hot (278 million Kelvin) plasma. Within a few days, as the plasma cooled and dissipated, low-energy X-rays from the still-burning white-dwarf surface began to outshine the plasma. In analyzing the NICER spectra at various stages of the outburst, the team confronted the data with models of X-ray emission from plasmas that are collisionally ionized - i.e., in which collisions between atoms in the hot gas are sufficiently energetic to knock electrons out of their orbits around the atomic nuclei. Additional collisions between atoms and freed electrons liberate still more electrons. At the same time, some electrons recombine with previously-ionized atoms. Depending on the timescales of these interactions and dynamic inputs to the gas - such as from an explosive shock wave passing through, or slow cooling - ionization and recombination can reach an equilibrium or can be well out of equilibrium. Islam et al. find that non-equilibrium ionization models fit the early NICER data much better than do equilibrium models. They also find that up to 40% of the early-time emission is obscured by relatively cold gas intervening along our sight-line, but that this "covering" fraction decreases over time, evidence that the ejecta first interact with the companion star's dense equatorial wind but later encounter less-dense polar regions as they expand outward.
Much remains to be explored in this rich dataset, including the evolving properties of the soft X-ray emission from the white-dwarf's surface, which has previously been shown to be pulsed with that star's approximately 35-second rotation period.
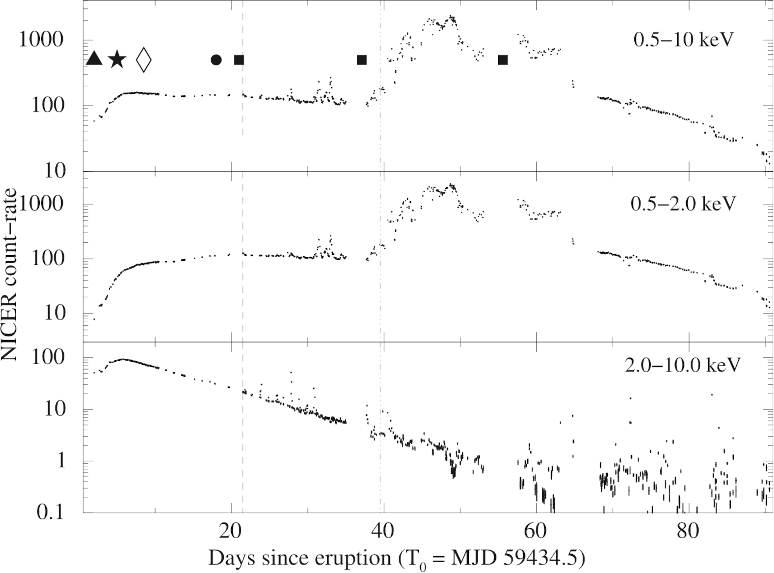
Left: X-ray brightness evolution of RS Oph during its 2021 outburst as measured with NICER, in photon detections per second; each point represents up to 1000 sec of exposure. The top panel shows the count-rate in almost the full NICER photon energy band (0.5-10 keV), while the middle and lower panels separate the contributions above and below 2 keV photon energy; note the logarithmic scales in all panels. Time zero is 1200 UT on August 8, 2021. Symbols in the upper panel represent the times of peak low-energy and high-energy gamma-ray brightness (triangle and star, respectively), and observations with NASA's NuSTAR (diamond), Chandra (circle), and ESA's XMM-Newton (squares) X-ray observatories. (Figure credit: Islam et al. 2024).
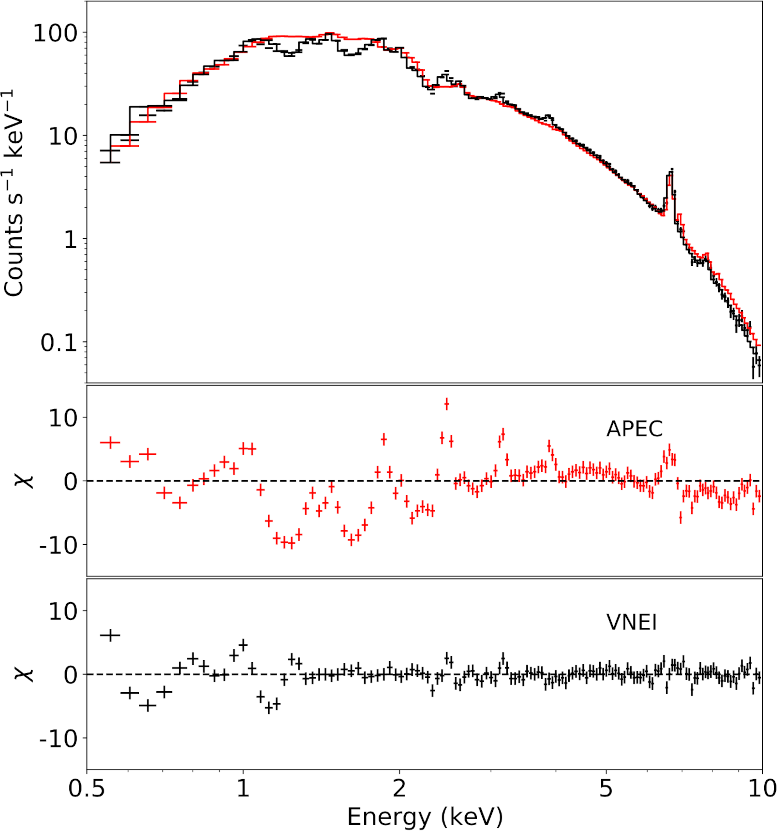
Right: Top panel: NICER spectrum (black crosses) of RS Oph obtained on Day 11 of the outburst, with two model spectra overlain (stepped traces). Lower panels: Data-minus-model "residual" differences, scaled for each measured point by the size of its error bar. The spectral model shown in red represents emission expected from a plasma in ionization equilibrium (APEC), while that in black is for a non-equilibrium plasma (VNEI), which clearly yields smaller residuals and thus provides a better description of the data. (Figure credit: Islam et al. 2024).
<< Previous
Main Index
Next >>

